
RISR & FIXP Commentary for July 2026
Click here for a pdf version of this commentary.
RISR Performance Summary
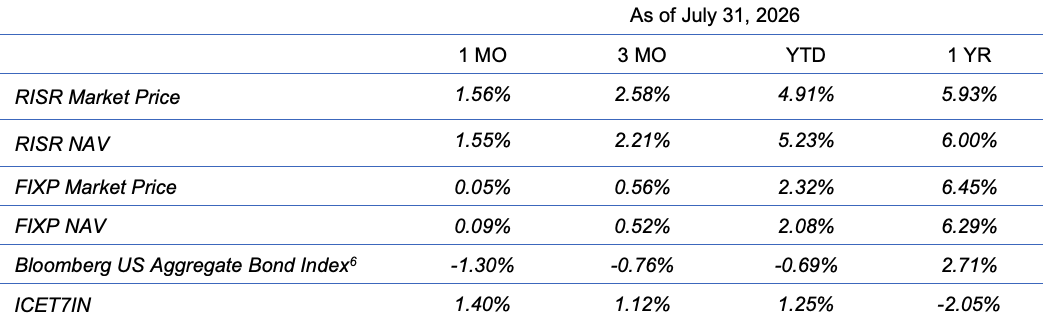
The FolioBeyond Alternative Income and Interest Rate Hedge ETF (ticker: RISR) returned 1.56% based on the closing market price (1.55% based on net asset value or “NAV”) in July. In comparison, the ICET7IN Index (US Treasury 7-Year Bond Inverse Index) returned 1.40% while the Bloomberg Barclays U.S. Aggregate Bond Index ("AGG") returned -1.30% during the same period.
The performance data quoted represents past performance. Past performance does not guarantee future results. The investment return and principal value of an investment will fluctuate so that an investor’s shares, when sold or redeemed, may be worth more or less than their original cost and current performance may be lower or higher than the performance quoted. Performance current to the most recent month-end can be obtained by calling 866-497-4963. Short-term performance, in particular, is not a good indication of the fund’s future performance, and an investment should not be made based solely on returns. Returns beyond 1 year are annualized.
A fund's NAV is the sum of all its assets less any liabilities, divided by the number of shares outstanding. The market price is the most recent price at which the fund was traded. The fund intends to pay out income, if any, monthly. There is no guarantee that these distributions will be made.
Total Expense Ratio is 1.04%.
For standardized performance click here.
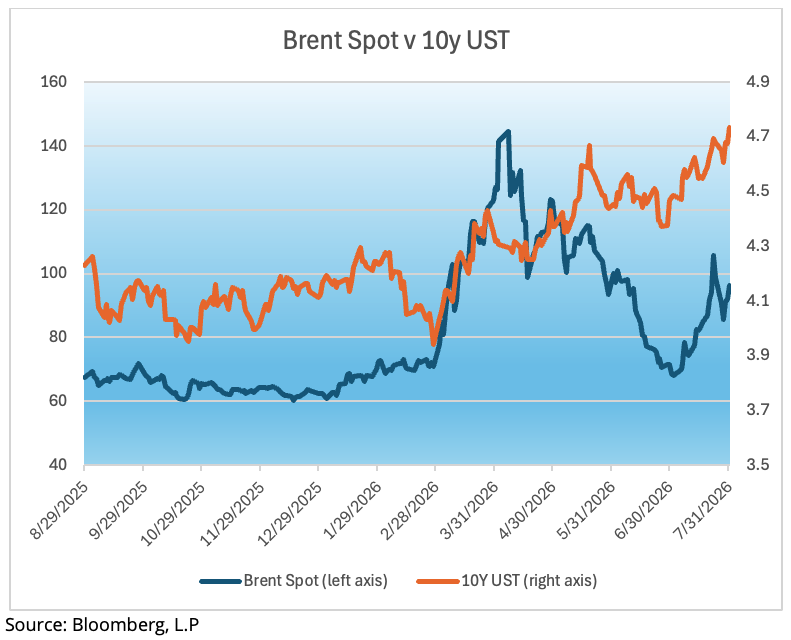
As many observers, including us, predicted, the June Memorandum of Understanding (MOU) between the US and Iran proved to be tissue thin. There never actually was a complete cessation of hostilities, and all pretense was eliminated in July. In some ways, the level of military activity was worse than before the MOU as Iran expanded its missile attacks against a broader array of targets including targets in neighboring Gulf states. Oil markets responded as one would expect, with Brent crude jumping from below $70/bbl. to more than $105/bbl. in the space of 3 weeks. July actually saw the largest monthly increase in oil prices since the start of the war in March. This revived concerns about inflation, which pushed interest rates up as well. Indeed, since the conflict began, oil prices and interest rates have become increasingly connected, as the chart below shows.
The inflation data, which is backward looking, was somewhat softer than the surprisingly high readings in May, but with PCE coming in at 3.7% YOY, inflation remained stubbornly above the Federal Reserve’s stated 2% target. Inflation has now been above the Fed’s target since February 2021, some 66 months. PCE has climbed 1.4 percentage points since the most recent low in April 2025. The recent trend is not favorable.
In light of the current data, the Fed decided to leave the Fed Funds rate unchanged at its July meeting, albeit with an unusual number of dissenting voters—3 of 12—arguing for a rate hike of at least 25 basis points. Fed Chair Kevin Warsh is facing an increasingly hawkish FOMC as he begins his new term. In addition, bond markets responded to Warsh’s post-meeting press conference by pushing long rates even higher. Warsh has a distinctly different communication style from his recent predecessors, and this seems to have upset bond investors. Specifically, he has stated he wants to dispense so-called “forward guidance.” Powell, Yellen and especially Bernanke all engaged in this to some extent, whereby they expose the thinking of FOMC members regarding the likely future path for the Fed Funds rate. The theory behind forward guidance is that it gives investors a better idea of the tendencies of FOMC members. In practice, some, including Fed Chair Warsh, believe it has led to an undue reliance by investors on Fed officials’ statements and speculation rather than on the financial markets and economic conditions. In any case, markets disdained the new approach.
The financial press was full of commentary to the effect that the rise in long-term rates post FOMC proves the need to Warsh to opt for a less terse communication style. We doubt it. After all, if the goal is to bring inflation down, a 20 bps bump in long-term rates is far more economically impactful than a 25 bps bump in the overnight Fed Funds rate. Secretly, he may be quite pleased with the market reaction. This may be especially true given other signals that economic growth may be softening. GDP and labor conditions both were lower recently than at the start of the year. Doing nothing on Fed Funds, but allowing long-term rates to climb preserves the Fed’s flexibility while it waits for more data.
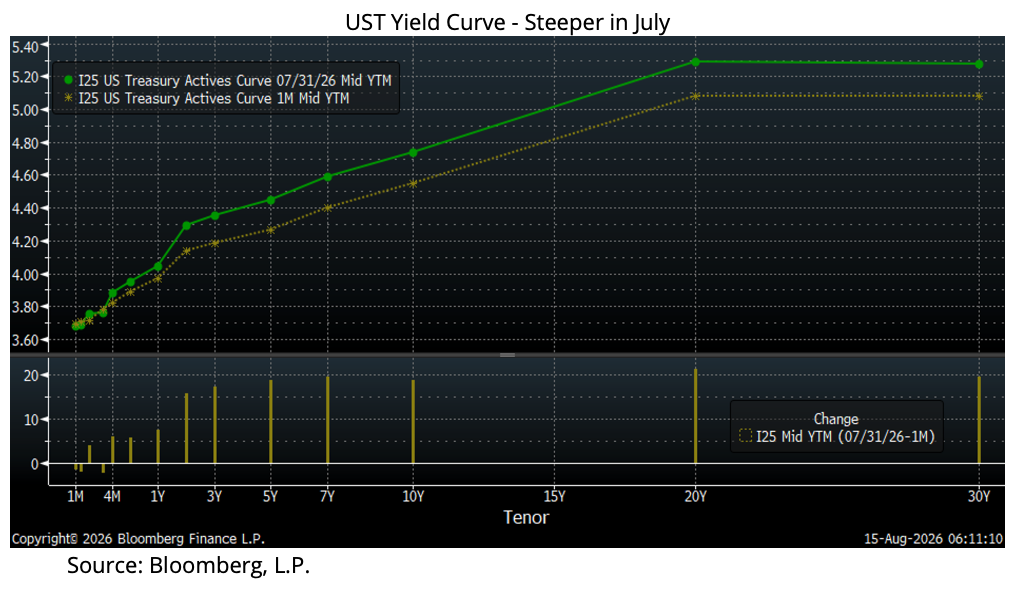
Besides a jump in rates generally, the yield curve steepened quite a bit in July, with long- term rates increasing much more than short-term rates. As the chart below shows, maturities from 7 years or greater increased by 20 bps or more, while 1 year or shorter were only higher by around 5 bps. This “bear steepener” is an ideal environment for RISR. Higher long-term rates cause mortgage prepayment speeds to decline which leads to price appreciation for our Interest-Only (IO) holdings, while current dividend income is less affected. For RISR this produced the best 1-month return since March 2026, and the second best since April 2026.
As we have discussed in prior notes, we have been taking advantage of the generally higher rate environment to add exposure to higher interest rate MBS. When rates dipped in Q1 there was a notable pickup in prepayment speeds for mortgages with higher interest rates. Loans with 2%-3.5% rates were largely unaffected. This provided an opportunity to start legging into higher coupon mortgage pools at more attractive prices, consistent with our belief that rates would ultimately rebound. As they have. We have continued opportunistically to invest in IOs backed by 4%-5% coupon mortgage pools. This can add OAS and yield to the portfolio overall.
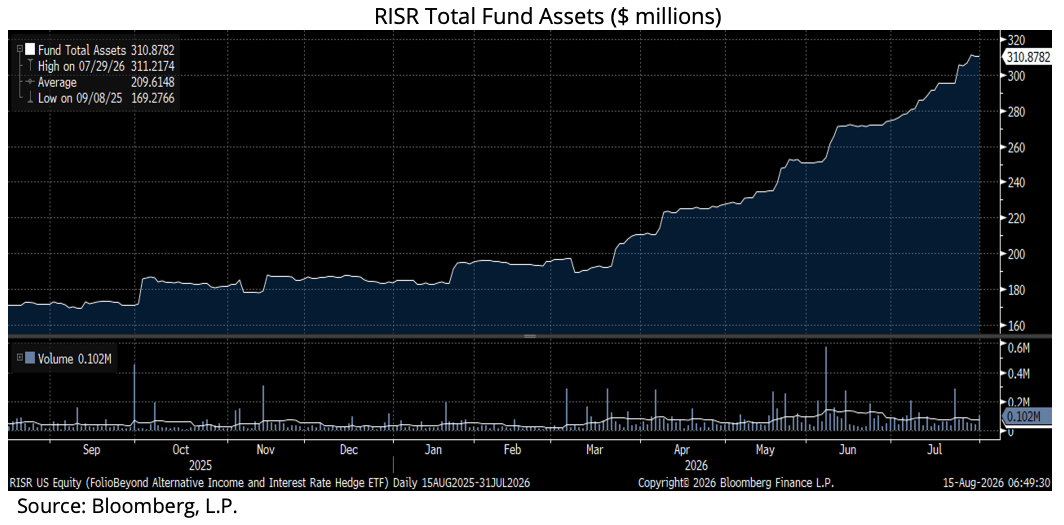
Total fund assets continued to increase in July. Asset growth has been strong all year, and at the end of the month total fund assets stood at almost $311 million. This represents an increase of around 70% since the start of 2026. We are grateful for the confidence investors have placed in us and the RISR strategy.
FIXP Performance Summary
FolioBeyond’s Enhanced Fixed Income Premium ETF (ticker: “FIXP”) seeks to provide income and, secondarily, long-term capital appreciation. The Fund invests in a portfolio of ETFs representing certain sectors of the fixed income market. In addition, the Fund seeks to generate additional income by writing options on these same ETFs, or other ETFs we believe have attractive prices and desirable correlation and volatility characteristics.
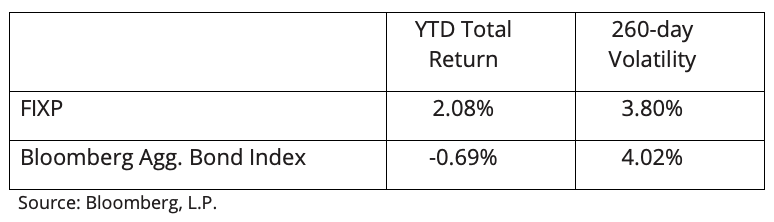
For the month of July, FIXP returned 0.05% (0.09% based on NAV). FIXP managed to generate a positive return despite the increase in rates generally, as described above. In fact, the broad bond market, as measured by the Bloomberg Aggregate Index, was down by 1.3% for the month. In addition to monthly outperformance, FIXP has outpaced the broad index by 277 bps year-to-date, and it has done so with materially lower volatility.
There were no portfolio reallocations during the month, other than those produced by differential asset performance. At month end, FIXP’s holdings were as follows.
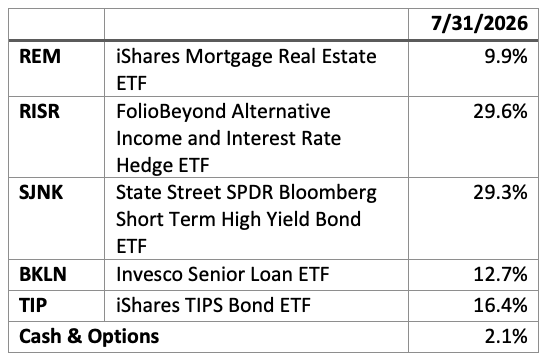
FIXP’s performance in July was adversely affected by the underperformance of REM, which returned -2.49%. Much of this was offset by the strong positive performance of RISR. Despite its relatively high price volatility, REM earns its position in the portfolio in part due to its strong quarterly dividend that amounts to nearly 9% annualized over the last 12 months.
There was no options overlay during July due to adverse pricing, i.e. high implied volatility. As of this writing, the overlay is back in place.
The fund’s holding weights are produced by FolioBeyond’s dynamic reallocation model. Changes are made from a universe of 24 economically diverse fixed income ETFs, based on volatility, momentum, yield, default risk, and other factors and occur based on market observations rather than a fixed schedule.
The performance data quoted represents past performance. Past performance does not guarantee future results. The investment return and principal value of an investment will fluctuate so that an investor’s shares, when sold or redeemed, may be worth more or less than their original cost and current performance and may be lower or higher than the performance quoted. Performance current to the most recent month-end can be obtained by calling 866-497-4963. Short-term performance, in particular, is not a good indication of the fund’s future performance, and an investment should not be made based solely on returns. Returns beyond 1 year are annualized.
A fund's NAV is the sum of all its assets less any liabilities, divided by the number of shares outstanding. The market price is the most recent price at which the fund was traded. The fund intends to pay out income, if any, monthly. There is no guarantee that these distributions will be made.
Total Expense Ratio is 1.03%.
For FIXP standardized performance and fund holdings click here.
The allocation model that FIXP uses has been running for private clients and model portfolios for more than three years, and we are very excited to be bringing this advanced algorithm to ETF investors. Please reach out to us to learn more and to obtain detailed information and fund documents.
Market Review and Outlook
Something Other than War, AI and the Federal Reserve
For the last several letters, we have discussed the three big market topics of War/Oil, AI bubble or not, and Federal Reserve policy. While those remain to most salient areas of market focus, it is worth focusing some attention on other matters, as well.
The first is the growing recognition that the federal budget deficit and spending may be reaching a tipping point. Interest on the debt is growing rapidly. Interest expense now exceeds defense spending and is closing in on Medicare and Social Security. On current trends, interest payments will be the largest single category in the next year or two.
Two things are driving this phenomenon. First, is simply the amount being added to the debt through deficit spending. Since the beginning of President Trump’s first term until today, deficit spending has added nearly $20 trillion to the debt, doubling its size to nearly $40 trillion[1]. On current trends, by the end of Trump’s second term, his administration will have added almost $10 trillion in this term alone, roughly 50% of the $20 trillion total when he first took office. Over the last three administrations, the US has seen a 7.3% CAGR for the federal debt balance, which is roughly 30% faster than the annual nominal growth in GDP over the same time. But presidents of both parties, and the Congress are equally at fault here. There is simply no constituency for fiscal restraint in the federal government from either party, aside from a handful of gadflies.
[1] A portion of this is intra-governmental debt. However, these figures also exclude state and local indebtedness, which increases to total by 20-30%. Also, Covid response increased short term deficit spending, but did little to alter the long-term trajectory.
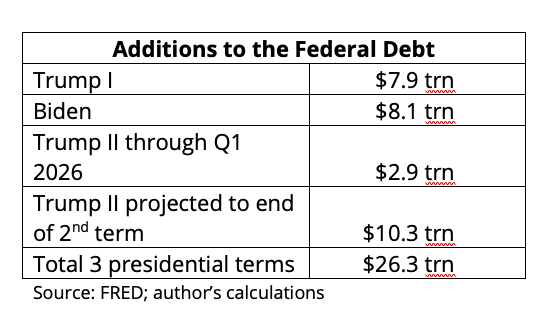
The point of this is not to make a political judgment, but rather to highlight what financial markets are finally coming around to: namely, that federal spending is on a trajectory that is historically without precedent, and appears to be unsustainable.
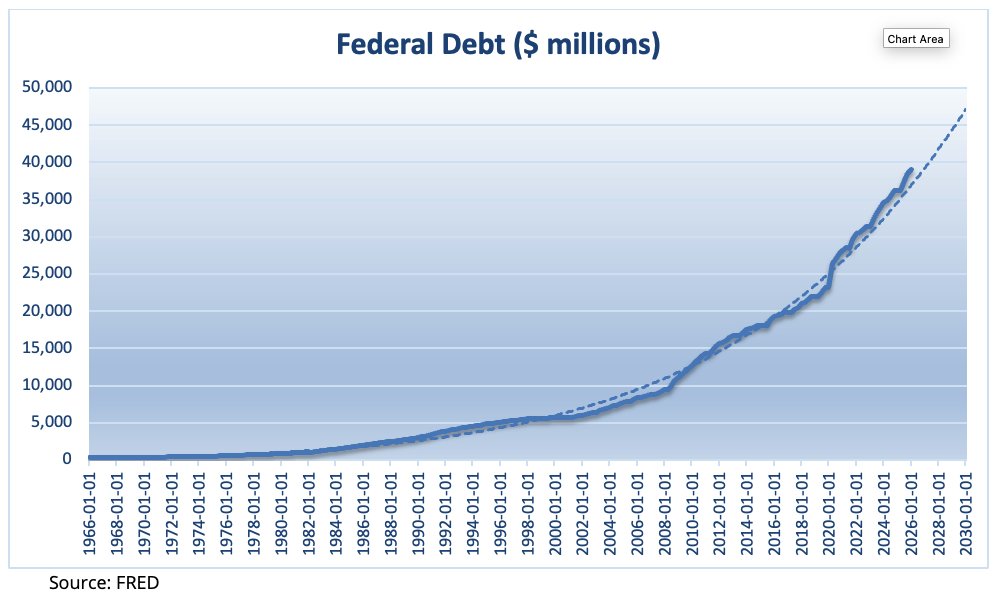
The second factor is that a portion of the existing debt comes due and must be refinanced each year. If interest rates remain at current levels, it will exacerbate the total spending challenges. A detailed analysis is beyond the scope of this discussion, but using Congressional Budget Office estimates, a 1% increase in interest rates across the curve increase the net interest expense by something like $300 billion per year over 5 years, an additional 25-30% relative to current interest expense. This is in addition to the figures above. Financial markets are beginning to price in the possibility that US government is nearing a fiscal crisis. Ironically, the natural response to such concerns is to demand higher yields to compensate for the risk. Yet, this makes the crisis all the more acute.
Another seemingly intractable problem that got market participants’ attention in July, is the rapidly deteriorating fiscal situation in Japan. Japan does not get a lot of mainstream attention, because it is a seemingly stable and reliable US ally. It is also the largest sovereign holder of US Treasury debt with aggregate holdings of around $1.2 trillion. But for decades Japan has engaged in significant financial repression, keeping interest rates extremely low through a variety of measures. Partly in response to this, the yen has been falling in value and now sits at its weakest level in four decades. The Bank of Japan made some token steps to support the yen, including raising its central bank rate to 1% in June. It also sold some of its US treasury bond holdings to raise dollars, then sold to buy yen.
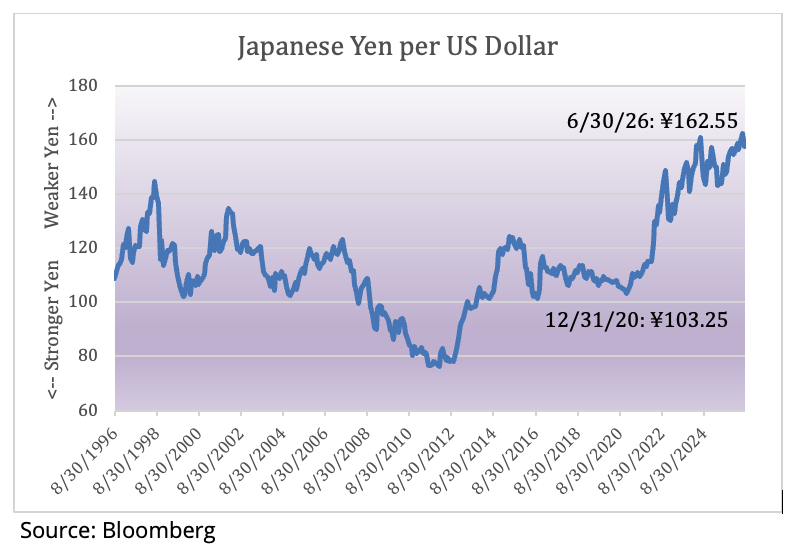
This did little to stem the tide, so in July the US Treasury engaged in an extraordinary intervention whereby the US Treasury sold euros to buy yen in an amount that may have been as large as $10 billion. That was a supplement to yen purchases by the BOJ. An additional twist was the use of a large repurchase facility, the Foreign and International Monetary Authorities Repo Facility (FIMA) whereby the BOJ could pledge, but not sell outright, Treasury bonds to the Federal Reserve in exchange for dollars, it could then sell to buy yen. This allowed BOJ to buy yen, without putting immediate downward pressure on US bond prices, and upward pressure on US interest rates.
This intervention, which was not contemplated when the FIMA was established, provided some near-term support to the yen’s foreign exchange value, but does nothing to solve the structural problems inside the Japanese economy. It did, however, prevent a fire-sale of US Treasury securities. It remains to be seen how sustainable such measures will be at forestalling lager sales of Treasuries from other nations facing similar problems. Treasury Secretary Bessent has stated he would like to increase the FIMA capacity above its current $60 billion per country cap.
Summary
The single positive force markets were clinging to for most of this year, AI abundance, has started to come under serious scrutiny. The US Iran war has entered into a grinding stalemate with no visible end in sight. The Fed is facing inflationary pressures that may force a series of rate hikes. The US fiscal situation is worsening and pressures on foreign holdings of US Treasury securities are growing. One looks in vain for positive signs that could bring US rates down meaningfully.
It is not time to panic, by any means, but it is time to take seriously the risks to your clients’ investment portfolios.
There is a well-established playbook for this type of environment. Protect your capital and look for investments that generate current cash income. Trading headlines or social media posts is contrary to prudent risk management. Carefully evaluate your risk exposures and position yourself to not get caught offsides if conditions deteriorate further.
Please contact us to explore how RISR and FIXP might fit into your overall strategy, to help you manage risk while generating an attractive current yield.
Performance
Portfolio Applications
We believe RISR and FIXP can provide attractive, thematic strategies that provide strong correlation benefits for both fixed income and equity portfolios. They can be utilized as part of a core holdings for diversified portfolios or as an overlay to manage the risks of fixed income portfolios. RISR can be used as a macro hedge against rising interest rates with less exposure to equity beta and negative correlation to fixed income beta. The underlying bonds are all U.S. agency credit that are guaranteed by FNMA, FHLMC or GNMA. Also, timing is on our side as the strategy generates current income if interest rates were to remain within a trading range. FIXP offers a broadly diversified exposure to multiple sectors of the fixed income markets in an algorithmically optimized manner.
Please contact us to explore how RISR and FIXP can be utilized as a unique tool to adjust your portfolio allocations in the current high volatility environment.
| Yung Lim | Dean Smith | George Lucaci |
|---|---|---|
| Chief Executive Officer | Chief Strategist and Marketing Officer | Global Head of Distribution |
| Chief Investment Officer | RISR Portfolio Manager | |
| ylim@foliobeyond.com | dsmith@foliobeyond.com | glucaci@foliobeyond.com |
| 917-892-9075 | 914-523-2180 | 908-723-3372 |
This material must be preceded or accompanied by a prospectus. For a copy of the prospectus please click here for RISR and here for FIXP.
Investments involve risk. Principal loss is possible. Unlike mutual funds, ETFs trade at a premium or discount to their net asset value. The fund is new and has limited operating history to judge fund risks. The value of MBS IOs is more volatile than other types of mortgage related securities. They are very sensitive not only to declining interest rates, but also to the rate of prepayments. MBS IOs involve the risk that borrowers default on their mortgage obligations or the guarantees underlying the mortgage-backed securities will default or otherwise fail and that, during periods of falling interest rates, mortgage-backed securities will be called or prepaid, which result in the Fund having to reinvest proceeds in other investments at a lower interest rate.
The Fund’s derivative investments have risks, including the imperfect correlation between the value of such instruments and the underlying assets or index; the loss of principal, including the potential loss of amounts greater than the initial amount invested in the derivative instrument. The value of the Fund’s investments in fixed income securities (not including MBS IOs) will fluctuate with changes in interest rates. Typically, a rise in interest rates causes a decline in the value of fixed income securities owned indirectly by the Fund. Please see the prospectus for a complete description of principal risks.
FIXP Risks
Underlying ETFs Risks. The Fund will incur higher and duplicative expenses because it invests in underlying ETFs, including Bond Sector ETFs and broad-based bond ETFs (collectively, “Underlying ETFs”). There is also the risk that the Fund may suffer losses due to the investment practices of the Underlying ETFs. The Fund will be subject to substantially the same risks as those associated with the direct ownership of securities held by the Underlying ETFs.
Fixed Income Risk. The prices of fixed income securities respond to economic developments, particularly interest rate changes, as well as to changes in an issuer's credit rating or market perceptions about the creditworthiness of an issuer. In general, the market price of fixed income securities with longer maturities will increase or decrease more in response to changes in interest rates than shorter-term securities.
Option Overlay Risk. The Fund's use of options involves various risks, including the risk that the options strategy may not provide the desired increase in income or may result in losses. Selling call and put options exposes the Fund to potentially significant losses if market movements are unfavorable. The Fund may also experience additional volatility and risk due to changes in implied volatility (the market's forecast of future volatility), strike prices, and market conditions. The Fund may sell options on instruments other than the Fund's Bond Sector ETFs. This can expose the Fund to the risk that options can vary in price in ways that do not correspond to the Bond Sector ETFs held by the Fund, so called basis-risk.
Interest Rate Risk. Generally, the value of fixed income securities will change inversely with changes in interest rates. As interest rates rise, the market value of fixed income securities tends to decrease. Conversely, as interest rates fall, the market value of fixed income securities tends to increase.
New Fund Risk. The Fund is a recently organized management investment company with no operating history. As a result, prospective investors do not have a track record or history on which to base their investment decisions.
Diversification does not eliminate the risk of experiencing investment losses.
Index Definitions
Bloomberg Barclays US Aggregate Bond Index: A broad-based benchmark that measures the investment grade, US dollar-denominated, fixed-rate taxable bond market. The index includes Treasuries, government-related and corporate securities, MBS (agency fixed-rate and hybrid ARM pass-throughs), ABS and CMBS (agency and non-agency).
US Treasury 7-10 Yr Bond Inversed Index: ICE U.S. Treasury 7-10 Year Bond 1X Inverse Index is designed to provide the inverse of the daily return of the ICE U.S. Treasury 7-10 Year Bond Index (IDCOT7). ICE U.S. Treasury 7-10 Year Bond Index tracks the performance of US dollar denominated sovereign debt publicly issued by the US government in its domestic market. Qualifying securities of the underlying index must have greater than or equal to seven years and less than 10 years remaining term to final maturity as of the rebalancing date, a fixed coupon schedule and an adjusted amount outstanding of at least $300 million.
S&P 500 Index: The S&P 500 Index, or Standard & Poor's 500 Index, is a market-capitalization-weighted index of 500 leading publicly traded companies in the U.S.
IBOXHY Index: iBoxx USD Liquid High Yield Total Return Index measures the USD denominated, sub-investment grade, corporate bond market. The index includes bonds with minimum 1 years to maturity,
minimum amount outstanding of USD 400 mil. Bond type includes fixed-coupon, step-up, bonds with
sinking funds, medium term notes, callable and putable bonds.
Definitions
Alpha: a return achieved above and beyond the return of a benchmark or proxy with a similar risk level.
Annualized Equivalent Yield: represents the annualized yield based on the most recent month of income distribution: (income distribution x 12 months)/price per share.
Basis Points (bps): Is a unit of measure used in quoting yields, changes in yields or differences between yields. One basis point is equal to 0.01%, or one one-hundredth of a percent of yield and 100 basis points equals 1%.
Beta measures: the volatility of a security or portfolio relative to an index. Less than one means lower volatility than the index; more than one means greater volatility.
Convexity: A measure of how the duration of a bond changes in correlation to an interest rate change. The greater the convexity of a bond the greater the exposure of interest rate risk to the portfolio.
Correlation: a statistic that measures the degree to which two securities move in relation to each other.
Coupon: is the annual interest rate paid on a bond, expressed as a percentage of the bond’s face value.
CUSIP: An identifier number that stands for the Committee on Uniform Securities Identification Procedures assigned to stocks and registered bonds in the United States and Canada.
Duration: measures a bond price’s sensitivity to changes in interest rates. The longer a bond’s duration, the higher its sensitivity to changes in interest rates and vice versa.
GNMA: Government National Mortgage Association
FNMA: Federal National Mortgage Association
FHLMC: Federal Home Loan Mortgage Corporation
Short Investment (Shorting): is a position that has been sold with the expectation that it will decrease in value, the intention being to repurchase it later at a lower price.
Distributed by Foreside Fund Services, LLC.