
RISR & FIXP Commentary for June 2026
Click here for a pdf version of this commentary.
RISR Performance Summary
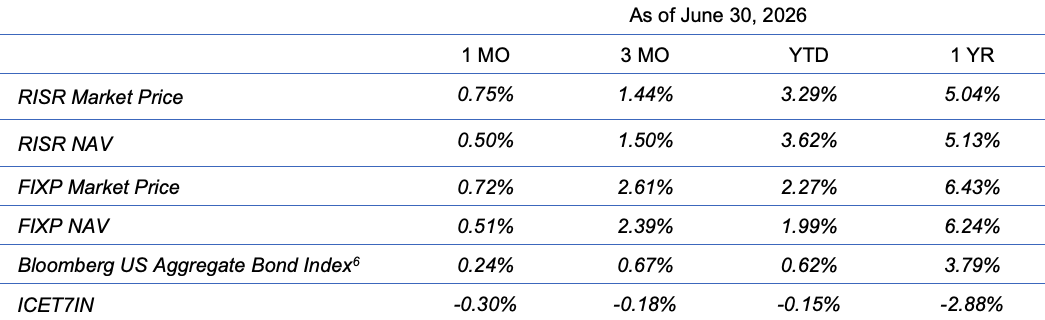
The FolioBeyond Alternative Income and Interest Rate Hedge ETF (ticker: RISR) returned 0.75% based on the closing market price (0.50% based on net asset value or “NAV”) in June. In comparison, the ICET7IN Index (US Treasury 7-Year Bond Inverse Index) returned -0.30% while the Bloomberg Barclays U.S. Aggregate Bond Index ("AGG") returned 0.24% during the same period.
The performance data quoted represents past performance. Past performance does not guarantee future results. The investment return and principal value of an investment will fluctuate so that an investor’s shares, when sold or redeemed, may be worth more or less than their original cost and current performance may be lower or higher than the performance quoted. Performance current to the most recent month-end can be obtained by calling 866-497-4963. Short-term performance, in particular, is not a good indication of the fund’s future performance, and an investment should not be made based solely on returns. Returns beyond 1 year are annualized.
A fund's NAV is the sum of all its assets less any liabilities, divided by the number of shares outstanding. The market price is the most recent price at which the fund was traded. The fund intends to pay out income, if any, monthly. There is no guarantee that these distributions will be made.
Total Expense Ratio is 1.04%.
For standardized performance click here.
The contrasts in market moving news in June were remarkable. After weeks of speculation and false starts, the US and Iran signed a Memorandum of Understanding (MOU), intended to form a framework for a durable cessation of hostilities and a re-opening of the Strait of Hormuz. While many observers were skeptical about the MOU, and exactly what had been agreed, financial markets took it as a positive sign, and oil prices declined significantly. Brent spot ended the month at 71.52/bbl, which was roughly the price before hostilities commenced in February. Several factors drove the sharp decline in oil prices after they peaked near 145 in April. Notably, the US and China eased market pressure by drawing down their strategic reserves. Following these actions, the market breathed a tentative, and perhaps premature, sigh of relief over the newly signed MOU.
So much for the positive. On the other side of the news page, newly installed Fed Chair Kevin Warsh gave his first post Fed meeting press conference, with no change to the Fed Funds 3.75% rate. Upon reflection markets ultimately weighed his tone as hawkish, and as many expected he would, he cautioned markets to expect much less forward guidance/speculation from the Fed going forward. In reality, he said very little other than emphasizing the Fed’s firm commitment to a 2% inflation target over time. Few see that happening anytime soon. Indeed, CPI inflation for May, reported in June came in at 4.2%, the highest level since May 2023. Energy prices are only a part of the story, and the detailed components were concerning, especially with respect to services which continued a firming trend that has been accumulating for several quarters.
In the real economy, GDP growth remained solid at more than 2%, and both jobs and consumer spending were good, albeit not great.
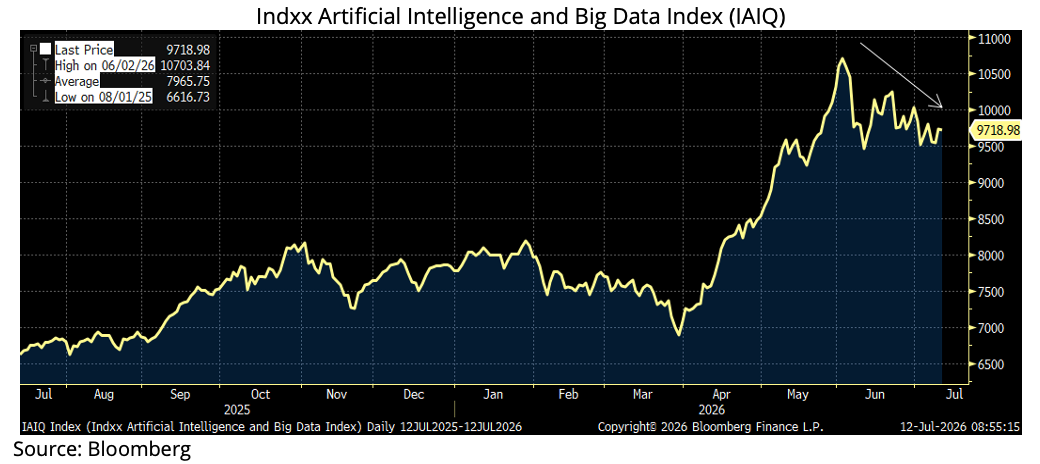
The bigger concern for financial markets was increasing questions about the durability and foundations for the AI-led tech boom in stock prices and capital spending. The reality is AI has been the driving force for the equity market gains for the last several years. Excluding the AI sector, stock price increases have quietly but meaningfully lagged the headlines over “record highs.”
After two-plus years of speculative frenzy, people have started doing math again, and many are coming to the conclusion that there might, in fact, be a “bubble” despite the very real benefits we can expect from AI adoption over the next 10+ years. The hyperbolic predictions that have been made about revolutionary change in macro-economies and human labor have run into the realities of public resistance and absence of measurable return on investment for businesses adopting AI. In addition, June saw new competition for the so-called hyper-scaler firms, principally OpenAI and Anthropic from newly introduced Chinese open-source models. These models have shown capabilities that rival that of the biggest US models at a small fraction of the cost to operate. It is true that many have security concerns about turning over sensitive proprietary data to Chinese model providers, but there are workarounds to cover those vulnerabilities. In short, while a collapse in stock prices may not be imminent, important questions are being asked about valuations, deployment costs and returns that had been largely overlooked until quite recently.
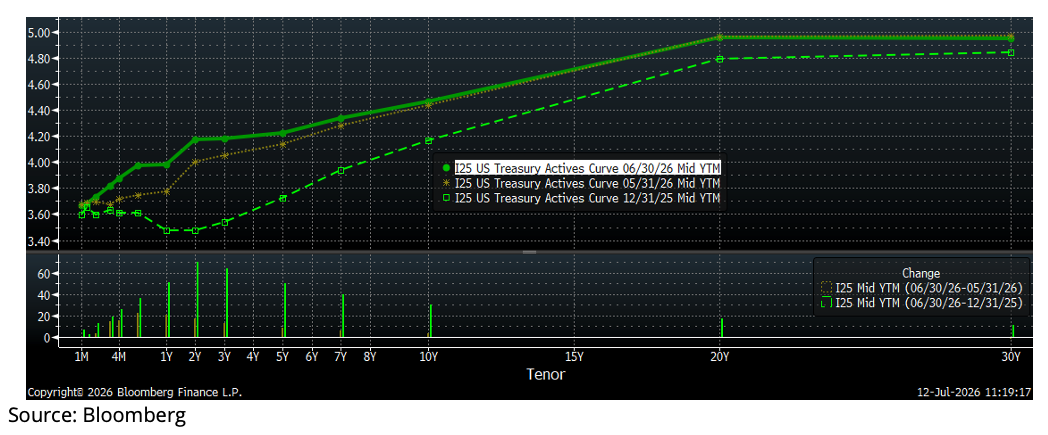
Adding the pluses and minuses, the result was a bear flattener for the month, with 2-year rates rising by around 20 bp, and long-term rates little changed, as seen in the chart below. For the first half of 2026, the 10-year Treasury rate is up 30 bps, and the 2-year is up 70 bps. The market has, finally conceded there will be no rate cuts coming from the Fed this year, barring some extreme surprise macro-event. This has been our view all year, and as a result we have positioned the fund for persistently higher rates, throughout the balance of 2026, and well into 2027.
One way we have acted on this conviction is a decision to increase the weighted average coupon of our Interest-Only holdings. We have actively been adding exposure to IOs backed by pools with net mortgage rates of 4.5% and higher. These bonds generally offer higher option-adjusted spreads, and higher yields, but also come with greater negative duration and negative convexity. In other words, such loans have a greater sensitivity to increased prepayment speeds if mortgage rates were to fall sharply. But, with current mortgage rates well above 6%, rates would have to fall materially to see a strong effect. Meanwhile, if rates stay at current levels or go higher, we would expect to see greater price gains than we would expect for our IOs with coupons in the 3-4% range. We can also achieve similar portfolio performance through asset selection to focus on bond structure, in addition to Weighted Average Coupon.
While it is too early to definitively demonstrate the impacts of these portfolio adjustments, we are encouraged by the fact that RISR returned 0.75% in a month where the yield curve flattened, which would typically be adverse to performance. We will continue to work to optimize the portfolio for the market scenarios we think most likely, while maintaining our negative duration discipline, that has served our investors’ diversification and risk management needs since the inception of the fund almost 5 years ago.
RISR continued to attract investor funds in June. Total AUM increased by around $23 million during the month, or almost 9% of AUM as of the end of May. We have begun an aggressive outreach to RIAs who previously may have been unable to buy the fund when it was smaller and had a shorter track record. We are hopeful we can continue to attract investor assets, which can increase liquidity and reduce expenses on a per share basis for both existing and new investors.
FIXP Performance Summary
FolioBeyond’s Enhanced Fixed Income Premium ETF (ticker: “FIXP”) seeks to provide income and, secondarily, long-term capital appreciation. The Fund invests in a portfolio of ETFs representing certain sectors of the fixed income market. In addition, the Fund seeks to generate additional income by writing options on these same ETFs, or other ETFs we believe have attractive prices and desirable correlation and volatility characteristics.
For the month of June, FIXP returned 0.72% (0.51% based on NAV). On a YTD basis, FIXP has increased its outperformance edge vs. the Bloomberg U.S. Bond Market Aggregate Index and for the first half of 2026 is beating the index by 165 bps, with a YTD total return of 2.27%. Moreover, FIXP has achieved this outperformance will very little additional volatility[1]: 4.83% for FIXP vs. 4.39% for the Aggregate Index.
Portfolio reallocations during the month were as shown below. These reallocations were made mid-month in response to changes in relative value, and especially in default and option adjusted yields for the high-yield municipal bond market (sell HYD) in comparison to the bank loan market (buy BKLN).
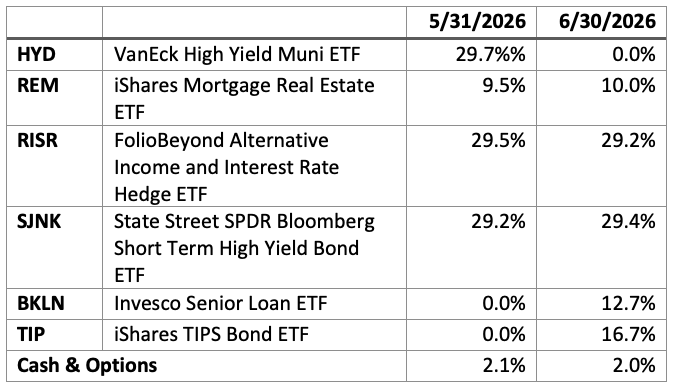
FIXP’s performance was helped by positive performance of the options overlay which contributed approximately 8 bps of positive performance for the month. Aside from that performance was driven by strong performance from RISR and especially from REM, an ETF that holds mortgage REITS. REM has for some time exhibited greater volatility than FIXP’s other holdings, but it provides significant diversification as well as an attractive 9% dividend.
The fund’s holding weights are produced by FolioBeyond’s dynamic reallocation model. Changes are made from a universe of 24 economically diverse fixed income ETFs, based on volatility, momentum, yield, default risk, and other factors and occur based on market observations rather than a fixed schedule.
[1] Source: Bloomberg, 90 day annualized volatility.
The performance data quoted represents past performance. Past performance does not guarantee future results. The investment return and principal value of an investment will fluctuate so that an investor’s shares, when sold or redeemed, may be worth more or less than their original cost and current performance and may be lower or higher than the performance quoted. Performance current to the most recent month-end can be obtained by calling 866-497-4963. Short-term performance, in particular, is not a good indication of the fund’s future performance, and an investment should not be made based solely on returns. Returns beyond 1 year are annualized.
A fund's NAV is the sum of all its assets less any liabilities, divided by the number of shares outstanding. The market price is the most recent price at which the fund was traded. The fund intends to pay out income, if any, monthly. There is no guarantee that these distributions will be made.
Total Expense Ratio is 1.03%.
For FIXP standardized performance and fund holdings click here.
The allocation model that FIXP uses has been running for private clients and model portfolios for more than three years, and we are very excited to be bringing this advanced algorithm to ETF investors. Please reach out to us to learn more and to obtain detailed information and fund documents.
Market Review and Outlook
It’s Kevin Warsh’s Federal Reserve Now
After decades of hyper-active and highly loquacious heads at the Federal Reserve, the Kevin Warsh era began in earnest with his post-FOMC press conference on June 17. At this highly anticipated event, Chair Warsh said, well, practically nothing. He did elaborate to say that he expected to say little to nothing going forward. It was a clear break from prior practice, and investors took notice.
Warsh stated explicitly that he aimed to phase out much of the forward guidance the Fed had been providing to markets since as far back as Ben Bernancke, at least. This would presumably include the infamous “dot-plots,” which is a basically meaningless graph whereby members of the Fed anonymously indicated their predictions/hopes/beliefs about the path of the Fed Funds rate two years into the future. As a predictive tool, it has shown almost no value historically, yet markets had come to treat it as oracular for some reason. Warsh has little use for it, and while it was published following this meeting, it is likely to be discarded before long. In order to do so, he intends to utilize the classic tool of Washington bureaucracy: the Task Force. He announced the creation of several new Tasks Forces, including one to examine and make recommendations on communications.
This de-emphasis on forward guidance and what amounts to public speculation by the Fed is clear break from recent Fed practice, that harkens back to the days of the recently-deceased Alan Greenspan and, before that, Paul Volcker. Both of these men were famous for saying almost nothing while using as many words as possible. Bernanke, who took the seat from Greenspan in 2006 was an academic economist (he subsequently won the Nobel Prize) who placed a great deal of value on public communication. He believed by pre-announcing the Fed’s intentions he could manage market inflationary expectations. It didn’t work, and Bernanke’s legacy as Fed Chair was instead the Great Financial Crisis, and a decade of Zero Interest Rate Policy, or as it came to be known “ZIRP.” Both Janet Yellen and Jerome Powell continued the Bernanke mode of public communication. Warsh intends to end it.
One of the most important takeaways from Warsh’s first press conference as Chair was the following statement:
I think financial markets perform best when they react to incoming data. I think the financial markets work less efficiently when they ask a question: ‘How will the Federal Reserve react to that incoming information?
He appears to sincerely want to eliminate the centrality of the Federal Reserve to all financial decision making. That means a lower profile, less active, smaller, and more humble Federal Reserve. Especially one that doesn't engage in endless public, speculative navel gazing. The consensus is that this represents a hawkish position, but this is not entirely clear. We will know how that works out 3-5 years from now. In the meantime, markets are on their own. And rate cuts are off the table for the balance of 2026, at least, and we believe much longer.
Is the AI Bubble Bursting, or Gently Deflating?
We discussed above, the recent market moves to reprice AI and tech more broadly that occurred in June. Two things can be true at once. First, AI is revolutionary technology, equal to or exceeding in impact electrification, development of means of mass transportation, and even the internet itself. There can be no question as to its importance for social, political and economic change. The only real questions are how long it will take, and how government policies will respond during the implementation.
Second, financial markets have a nasty history of massively over-valuing such innovations. Issac Newton himself lost a large sum in the South Sea Bubble of the early 1700s. Likewise vast fortunes were made and just as quickly lost during the railroad buildout in the late 1800s in the US. Many readers will recall the near back-to-back telecoms and dot com bubble/crash cycles of the late 20th century. There are countless other examples.
The point is not to suggest a similar crash is imminent, but to inject a note of caution. We do not aim to provide advice on stock investing, but we do hope to identify events and trends that could affect markets broadly, especially the areas on which we focus: interest rates and credit.
Trends in the AI adoption cycle will have profound effects for our markets, whether it’s coming from spending on data centers, massive anticipated equity and debt offerings from the hyper-scalers, chip design and manufacturing, or energy generation and transmission. Some observers have noted that, over the very long term, productivity gains can be deflationary. That will happen, if at all, on a time scale far longer than is relevant for most ordinary investors, i.e. over decades.
Meanwhile, in the time frame that is relevant for investment decisions today, the AI build-out is putting upward pressure on financial markets. Forecasts are for tens of trillions of dollars in capital spending, and nearly all of that is going to come from new capital, not from retained earnings. Massive amounts of debt and equity will have to be issued. So long as an outright collapse does not occur, it makes sense to prepare for higher rates and wider credit spreads, and to avoid over-concentrated bets on any sector, but especially tech. Our goal is to provide investors with tools to do that.
Oil, War and Government Spending
As of this writing, the MOU between the US and Iran is quickly unraveling. Anyone surprised by that simply has not been paying attention. The US and Iran have profoundly different goals in the quest to end the conflict. And the MOU addressed almost none of them adequately. One can hope for a lasting resolution, but given the disparate goals of the belligerents, none seems likely in the near term.
As noted above, the signing of the MOU induced a drop in oil process, but if shooting resumes, and shipping through the Strait of Hormuz remains hindered, this could prove to be short-lived. It is well that the most dire predictions of $150-200/bbl oil did not come to pass. But there is going be sustained pressure on energy markets for some time to come. Indeed, the White House recently announced an emergency national fertilizer shortage, related to severe shortages of petro-chemical inputs. More than ever before, financial markets react spasmodically to headlines, but much deeper problems remain, and governments in the US, EU and China are running out of magic tricks.
Meanwhile, the war effort has added tremendous additional fiscal strain on the federal government. Emergency supplemental spending requests approaching $100 billion have been proposed by the Trump Administration. It won’t be enough. Meanwhile there is no constituency in either part for fiscal restraint. As the mid-term elections approach in a few months, expect the spending promises to proliferate. As the One Big Beautiful Bill Act provisions continue to roll out, deficit projections go strictly in one direction. The need for additional debt issuance by the US government is seemingly boundless, and the new Fed Chair has expressed little interest in accommodating it by continuing to blow out the Fed’s balance sheet.
Summary
Risks abound in the current environment. If the prediction markets can be believed, the Trump Administration is going to face an increasingly hostile, Democrat-controlled Congress for the second half of his final term. While they are unlikely to obtain veto-proof majorities, they have openly discussed major rule changes, including elimination of the filibuster, which is practically the only thing reining in outright reckless behavior in Washington. And immediately following the mid-terms, the campaign for President will begin, with the so-called democratic socialist wing on the left rising in influence. In a word, the domestic political outlook is fraught.
There is a well-established playbook for this type of environment. Protect your capital and look for investments that generate current cash income. Trying to trade the news or time the markets in such an environment is reckless in the extreme. The news will always be faster and more unpredictable that you are as an investor.
Please contact us to explore how RISR and FIXP might fit into your overall strategy, to help you manage risk while generating an attractive current yield.
Performance
Portfolio Applications
We believe RISR and FIXP can provide attractive, thematic strategies that provide strong correlation benefits for both fixed income and equity portfolios. They can be utilized as part of a core holdings for diversified portfolios or as an overlay to manage the risks of fixed income portfolios. RISR can be used as a macro hedge against rising interest rates with less exposure to equity beta and negative correlation to fixed income beta. The underlying bonds are all U.S. agency credit that are guaranteed by FNMA, FHLMC or GNMA. Also, timing is on our side as the strategy generates current income if interest rates were to remain within a trading range. FIXP offers a broadly diversified exposure to multiple sectors of the fixed income markets in an algorithmically optimized manner.
Please contact us to explore how RISR and FIXP can be utilized as a unique tool to adjust your portfolio allocations in the current high volatility environment.
| Yung Lim | Dean Smith | George Lucaci |
|---|---|---|
| Chief Executive Officer | Chief Strategist and Marketing Officer | Global Head of Distribution |
| Chief Investment Officer | RISR Portfolio Manager | |
| ylim@foliobeyond.com | dsmith@foliobeyond.com | glucaci@foliobeyond.com |
| 917-892-9075 | 914-523-2180 | 908-723-3372 |
This material must be preceded or accompanied by a prospectus. For a copy of the prospectus please click here for RISR and here for FIXP.
Investments involve risk. Principal loss is possible. Unlike mutual funds, ETFs trade at a premium or discount to their net asset value. The fund is new and has limited operating history to judge fund risks. The value of MBS IOs is more volatile than other types of mortgage related securities. They are very sensitive not only to declining interest rates, but also to the rate of prepayments. MBS IOs involve the risk that borrowers default on their mortgage obligations or the guarantees underlying the mortgage-backed securities will default or otherwise fail and that, during periods of falling interest rates, mortgage-backed securities will be called or prepaid, which result in the Fund having to reinvest proceeds in other investments at a lower interest rate.
The Fund’s derivative investments have risks, including the imperfect correlation between the value of such instruments and the underlying assets or index; the loss of principal, including the potential loss of amounts greater than the initial amount invested in the derivative instrument. The value of the Fund’s investments in fixed income securities (not including MBS IOs) will fluctuate with changes in interest rates. Typically, a rise in interest rates causes a decline in the value of fixed income securities owned indirectly by the Fund. Please see the prospectus for a complete description of principal risks.
FIXP Risks
Underlying ETFs Risks. The Fund will incur higher and duplicative expenses because it invests in underlying ETFs, including Bond Sector ETFs and broad-based bond ETFs (collectively, “Underlying ETFs”). There is also the risk that the Fund may suffer losses due to the investment practices of the Underlying ETFs. The Fund will be subject to substantially the same risks as those associated with the direct ownership of securities held by the Underlying ETFs.
Fixed Income Risk. The prices of fixed income securities respond to economic developments, particularly interest rate changes, as well as to changes in an issuer's credit rating or market perceptions about the creditworthiness of an issuer. In general, the market price of fixed income securities with longer maturities will increase or decrease more in response to changes in interest rates than shorter-term securities.
Option Overlay Risk. The Fund's use of options involves various risks, including the risk that the options strategy may not provide the desired increase in income or may result in losses. Selling call and put options exposes the Fund to potentially significant losses if market movements are unfavorable. The Fund may also experience additional volatility and risk due to changes in implied volatility (the market's forecast of future volatility), strike prices, and market conditions. The Fund may sell options on instruments other than the Fund's Bond Sector ETFs. This can expose the Fund to the risk that options can vary in price in ways that do not correspond to the Bond Sector ETFs held by the Fund, so called basis-risk.
Interest Rate Risk. Generally, the value of fixed income securities will change inversely with changes in interest rates. As interest rates rise, the market value of fixed income securities tends to decrease. Conversely, as interest rates fall, the market value of fixed income securities tends to increase.
New Fund Risk. The Fund is a recently organized management investment company with no operating history. As a result, prospective investors do not have a track record or history on which to base their investment decisions.
Diversification does not eliminate the risk of experiencing investment losses.
Index Definitions
Bloomberg Barclays US Aggregate Bond Index: A broad-based benchmark that measures the investment grade, US dollar-denominated, fixed-rate taxable bond market. The index includes Treasuries, government-related and corporate securities, MBS (agency fixed-rate and hybrid ARM pass-throughs), ABS and CMBS (agency and non-agency).
US Treasury 7-10 Yr Bond Inversed Index: ICE U.S. Treasury 7-10 Year Bond 1X Inverse Index is designed to provide the inverse of the daily return of the ICE U.S. Treasury 7-10 Year Bond Index (IDCOT7). ICE U.S. Treasury 7-10 Year Bond Index tracks the performance of US dollar denominated sovereign debt publicly issued by the US government in its domestic market. Qualifying securities of the underlying index must have greater than or equal to seven years and less than 10 years remaining term to final maturity as of the rebalancing date, a fixed coupon schedule and an adjusted amount outstanding of at least $300 million.
S&P 500 Index: The S&P 500 Index, or Standard & Poor's 500 Index, is a market-capitalization-weighted index of 500 leading publicly traded companies in the U.S.
IBOXHY Index: iBoxx USD Liquid High Yield Total Return Index measures the USD denominated, sub-investment grade, corporate bond market. The index includes bonds with minimum 1 years to maturity,
minimum amount outstanding of USD 400 mil. Bond type includes fixed-coupon, step-up, bonds with
sinking funds, medium term notes, callable and putable bonds.
Definitions
Alpha: a return achieved above and beyond the return of a benchmark or proxy with a similar risk level.
Annualized Equivalent Yield: represents the annualized yield based on the most recent month of income distribution: (income distribution x 12 months)/price per share.
Basis Points (bps): Is a unit of measure used in quoting yields, changes in yields or differences between yields. One basis point is equal to 0.01%, or one one-hundredth of a percent of yield and 100 basis points equals 1%.
Beta measures: the volatility of a security or portfolio relative to an index. Less than one means lower volatility than the index; more than one means greater volatility.
Convexity: A measure of how the duration of a bond changes in correlation to an interest rate change. The greater the convexity of a bond the greater the exposure of interest rate risk to the portfolio.
Correlation: a statistic that measures the degree to which two securities move in relation to each other.
Coupon: is the annual interest rate paid on a bond, expressed as a percentage of the bond’s face value.
CUSIP: An identifier number that stands for the Committee on Uniform Securities Identification Procedures assigned to stocks and registered bonds in the United States and Canada.
Duration: measures a bond price’s sensitivity to changes in interest rates. The longer a bond’s duration, the higher its sensitivity to changes in interest rates and vice versa.
GNMA: Government National Mortgage Association
FNMA: Federal National Mortgage Association
FHLMC: Federal Home Loan Mortgage Corporation
Short Investment (Shorting): is a position that has been sold with the expectation that it will decrease in value, the intention being to repurchase it later at a lower price.
Distributed by Foreside Fund Services, LLC.