
RISR & FIXP Commentary for August 2026
Click here for a pdf version of this commentary.
RISR Performance Summary
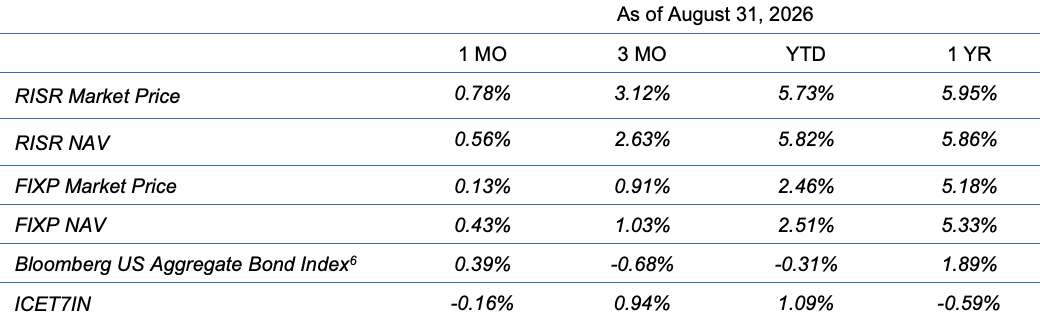
The FolioBeyond Alternative Income and Interest Rate Hedge ETF (ticker: RISR) returned 0.78% based on the closing market price (0.56% based on net asset value or “NAV”) in August. In comparison, the ICET7IN Index (US Treasury 7-Year Bond Inverse Index) returned -0.16 % while the Bloomberg Barclays U.S. Aggregate Bond Index ("AGG") returned 0.39% during the same period. The monthly dividend paid was $0.18 per share on a closing share price of $36.69, which translates to a 5.89% annualized dividend yield.
The performance data quoted represents past performance. Past performance does not guarantee future results. The investment return and principal value of an investment will fluctuate so that an investor’s shares, when sold or redeemed, may be worth more or less than their original cost and current performance may be lower or higher than the performance quoted. Performance current to the most recent month-end can be obtained by calling 866-497-4963. Short-term performance, in particular, is not a good indication of the fund’s future performance, and an investment should not be made based solely on returns. Returns beyond 1 year are annualized.
A fund's NAV is the sum of all its assets less any liabilities, divided by the number of shares outstanding. The market price is the most recent price at which the fund was traded. The fund intends to pay out income, if any, monthly. There is no guarantee that these distributions will be made.
Total Expense Ratio is 1.04%.
For standardized performance click here.
Interest rates in August followed a see-saw pattern of ups and downs, but the underlying trend remained towards higher rates generally. The labor market continued to defy predictions of impending recession; by any reasonable measure the US economy remains at full-employment. Job growth isn’t uniform across industries and sectors—it never is—but across the broad economy the labor market is sound. For a variety of reasons, the labor data produced by the Bureau of Labor Statistics has been particularly noisy of late, with large positive and negative revisions. Even so, looking at the medium- to longer-term trends, there is little indication of a jobs-led slowdown.
For this and other reasons, inflation remains well above the Federal Reserve’s stated 2% target, and no amount of spin or selective readings of the data can change that reality. Depending on which statistic one prefers, inflation readings released during the month showed annualized rates of at least 3%, and as much as 3.5%. There was no FOMC meeting during August, but Fed Chair Warsh’s comments at the annual Jackson Hole gathering were read by many as hawkish, despite a lack of outright statements of his intentions. Consequently, the yield curve flattened by some 20 bps (2s vs 10s) as predictions for rate hikes became solidly priced in.
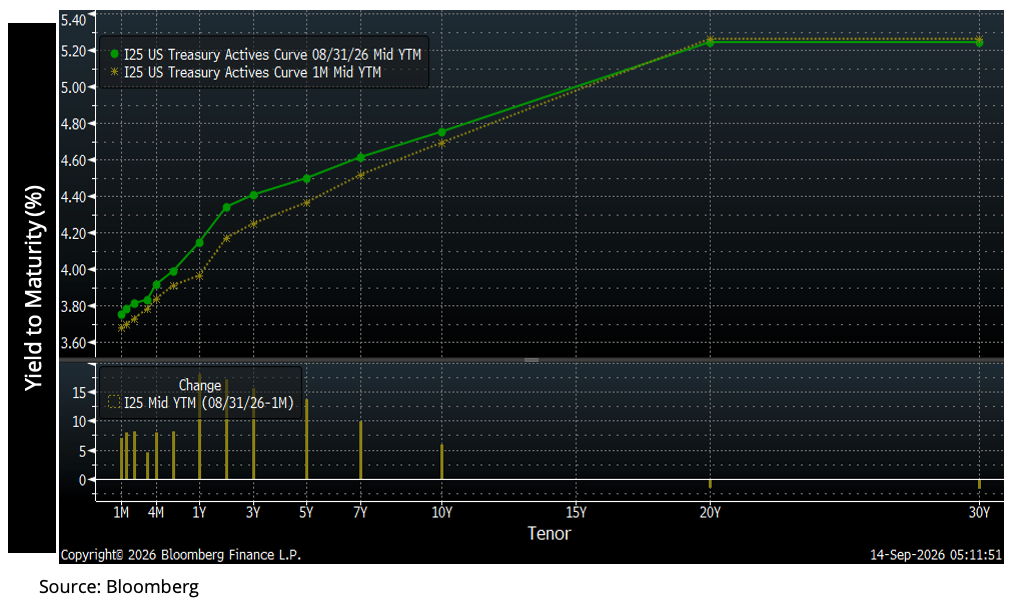
As we have noted in prior messages, a flattening yield curve can hamper RISR’s short-term performance, but for now this is mostly noise, not signal. We firmly hold to our view that for reasons we will explore more fully below, rates are headed higher, and there is little the Fed or the administration can do to alter that trend.
That reality doesn’t stop them from trying, however. During August Treasury Secretary Bessent announced with great fanfare a plan to double or even triple the Treasury’s plans to repurchase longer term Treasury bonds and to fund the purchases by issuing shorter maturity bills and notes. On August 19, he announced repurchases of $4bn to as much as $6 bn. The market reacted by sending long term bond yields down, but the impact was extremely short-lived. By month-end, the 10-year yield was higher than it had been prior to his announcement.
The problem is one of scale. Purchases of single-digit billions are not even rounding error in the global US Treasury market. Daily trading volume runs around $1 trillion, and total bonds outstanding total around $30 trillion. A buyback of $6 bn is not likely to move the needle. This is especially so as reports came out that other large holders of US Treasury debt were and will continue to be net sellers. This includes, most notably Japan, which is fighting a battle of its own against a falling yen that is driving inflationary pressures there, independent of conditions in the US. A “repo-facility” announced by Bessent quickly was revealed to be a “nothing burger.” Bessent seems to be badly mis-reading the market, perhaps blinded to a time many years ago, and under entirely different conditions when he was working for George Soros. In that well-known story, in 1992 Soros “broke the bank of England” by selling short UK pounds in an amount around $10 billion. At that time, it represented a short position roughly equal to 5% of total UK sovereign debt outstanding. And the UK was in a much weaker economic position than as compared to the US today. In short, that playbook no longer works.
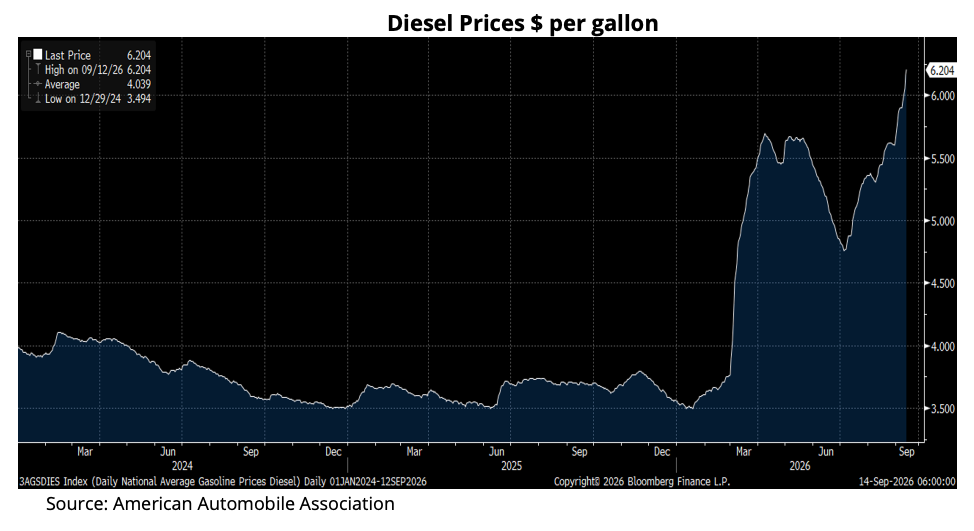
The other headwind pushing inflation and rates higher is the war with Iran. Whatever one thinks about the strategic necessity of the US military actions, the effort has been a disaster economically. Each time there is any hint of good news about peace or increasing oil flows, it is quickly reversed by reality. Brent crude rebounded by 8% in August. More troubling was the continued climb in diesel prices in the US. As Al Pacino, playing Jimmy Hoffa, said in the movie “The Irishman:”
“If you got it, a truck brought it to you. If you got your food, your clothing, your medicine, if you got fuel for your homes, fuel for your industries, a truck brought it to them!”
This deeply embedded cost is driving inflation higher for almost all physical good US consumers and businesses purchase.
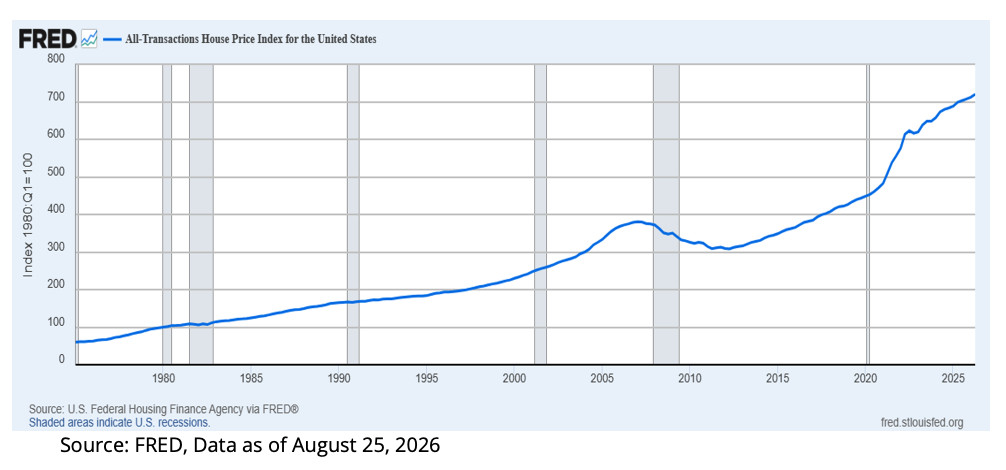
Finally with specific application for RISR, mortgage prepayments slowed even further in August, which is traditionally one of the faster months for prepayment activity as households aim to get settled into new homes before their children return to school. But with mortgage rates holding well above 6.5%, and even above 7% in some markets, families are staying put. This is further reinforced by home prices. There are some fleeting signs of softening in some markets, but these signs are isolated and faint. Home prices nationally remain at all-time highs, and are approaching double the levels seen just before the last cyclical peak in 2007.
Total fund assets continued to increase in August. Asset growth has been strong all year, and at the end of the month total fund assets stood at almost $326 million. This represents an increase of more than 75% since the start of 2026. In addition, RISR was recently approved for the LPL financial-advisor platform, which opens access for more than 30,000 advisors managing more than $2.5 trillion in investor funds. This is a significant milestone, and something we have been working on. We are grateful for the confidence investors have placed in us and the RISR strategy.
FIXP Performance Summary
FolioBeyond’s Enhanced Fixed Income Premium ETF (ticker: “FIXP”) seeks to provide income and, Secondarily, long-term capital appreciation. The Fund invests in a portfolio of ETFs representing a broad array of sectors of the fixed income market. In addition, the Fund seeks to generate additional income by writing options on these same ETFs, or other ETFs we believe have attractive prices and desirable correlation and volatility characteristics.
For the month of August, FIXP returned 0.13% (0.43% based on NAV). FIXP managed to generate a positive return despite the increase in rates generally, as described above. Year-to-date the broad bond market, as measured by the Bloomberg Aggregate Index, was down by 0.31% while FIXP is up 2.46%, an out-performance of 277 bps. The August monthly dividend was $0.08 per share on a closing share price of $19.78.
There were material portfolio reallocations during the month. The fund sold its positions in TIPs (TIP) and Bank loans (BKLN) and added municipal credit (HYD) and a small amount of Treasury exposure (TLT). At month end, FIXP’s holdings were as follows.
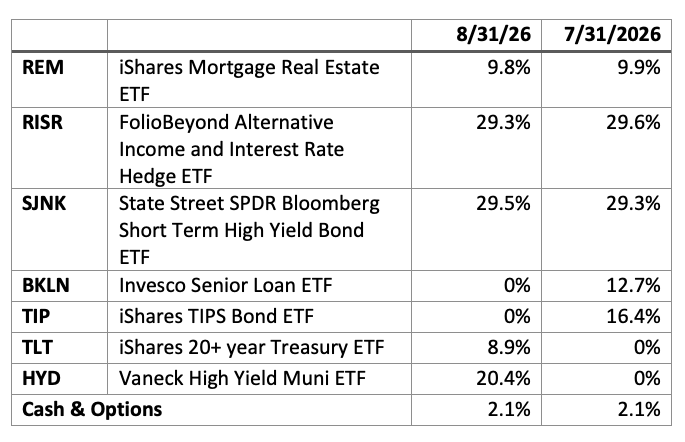
FIXP’s performance in August was positively affected by the strong performance of RISR and of BKLN, as well as the new allocation to TLT. It should be noted, that FIXP follows a tactical reallocation model. So, an allocation to TLT is not at odds with a longer-term view that rates are generally headed higher. Instead, the model detected a favorable risk-reward-momentum pattern for TLT and HYD, despite their positive duration. It likewise detected an unfavorable pattern for TIP and BKLN. Overall, with holding in RISR and SJNK, the fund does not currently carry a great deal of interest rate exposure.
The option overlay contributed a modest positive mark-to-market performance in August.
The fund’s holding weights are produced by FolioBeyond’s dynamic reallocation model. Changes are made from a universe of 24 economically diverse fixed income ETFs, based on volatility, momentum, yield, default risk, and other factors and occur based on market observations rather than a fixed schedule.
The performance data quoted represents past performance. Past performance does not guarantee future results. The investment return and principal value of an investment will fluctuate so that an investor’s shares, when sold or redeemed, may be worth more or less than their original cost and current performance and may be lower or higher than the performance quoted. Performance current to the most recent month-end can be obtained by calling 866-497-4963. Short-term performance, in particular, is not a good indication of the fund’s future performance, and an investment should not be made based solely on returns. Returns beyond 1 year are annualized.
A fund's NAV is the sum of all its assets less any liabilities, divided by the number of shares outstanding. The market price is the most recent price at which the fund was traded. The fund intends to pay out income, if any, monthly. There is no guarantee that these distributions will be made.
Total Expense Ratio is 1.03%.
For FIXP standardized performance and fund holdings click here.
The allocation model that FIXP uses has been running for private clients and model portfolios for more than three years, and we are very excited to be bringing this advanced algorithm to ETF investors. Please reach out to us to learn more and to obtain detailed information and fund documents.
Market Review and Outlook
Deficits Here, Deficits There, Deficits Everywhere
It’s always hard to guess in advance what will capture the market’s attention. In August it was the fact that the US federal government debt cross $40 trillion for the first time. Now, $40 trillion is a very large number, but this was as predictable as the NY Mets falling to last place in their division. No one should have been surprised by this.
Nevertheless, the financial press was awash with stories claiming some sort of tipping point had been reached. Why $40 trillion is a tipping point when $30 trillion and $35 trillion were not, is left unexplained. In any case, most—but certainly not all—market participants have concluded that something has to be done to reduce the rate of spending increase by the federal government. The problem is no one is making any serious proposals to do that. The President has been largely silent on the issue, and Treasury Secretary Bessent has argued that the US economy will somehow grow fast enough to catch up. Simple math reveals this would require a rate of economic growth that is simply beyond the reach of a mature, post-industrial economy like that of the US.
The Congress, where spending and taxation decision-making lies, has largely taken the year off in 2026. In fact, the United States Congress has not passed all regular appropriation bills, i.e., a full budget, since 1997. Instead, appropriations are made through continuing resolutions and omnibus packages no one understands. There is simply no constituency whatsoever in DC for fiscal discipline. Spending just continues to expand more or less on auto-pilot. Except, of course, when special requests for additional spending are made like the nearly $100 billion supplemental request recently proposed by Defense Secretary Hegseth.
All of this is well understood by honest observers, but in August it became news. Unfortunately, no one in a position of true political power has put forth a plan to change the course of spending. And this is despite the fact that interest on the debt will soon, perhaps by 2028, surpass Medicare. Interest is currently the fastest growing item in the federal budget.
This puts the Federal Reserve in an impossible position. The Fed obviously has no control over deficit spending and can only react to the reality it faces. If it raises rates, just as the Treasury is increasing short term debt as compared to long term debt, then interest expense accelerates further. If it fails to raise rates, and inflation expectations take another step up, this puts pressure on long term rates, and interest expense accelerates further. The US is like an over-extended household that keeps getting new credit cards to service the debt on the maxed-out cards it already holds.
As long as investors, particularly foreign governments and central banks who hold a large share of the total, continue to have confidence in the US’s ability to pay interest and principal on a timely basis, this can in theory continue for a time. But there is growing evidence their confidence is waning. China, which holds some $630 billion in Treasury bonds, has been aggressively selling. As mentioned above, so has Japan, which is the largest foreign holder. Canada is another large holder, and in August President Trump launched a new trade war with its neighbor, so we will have to see how that situation evolves.
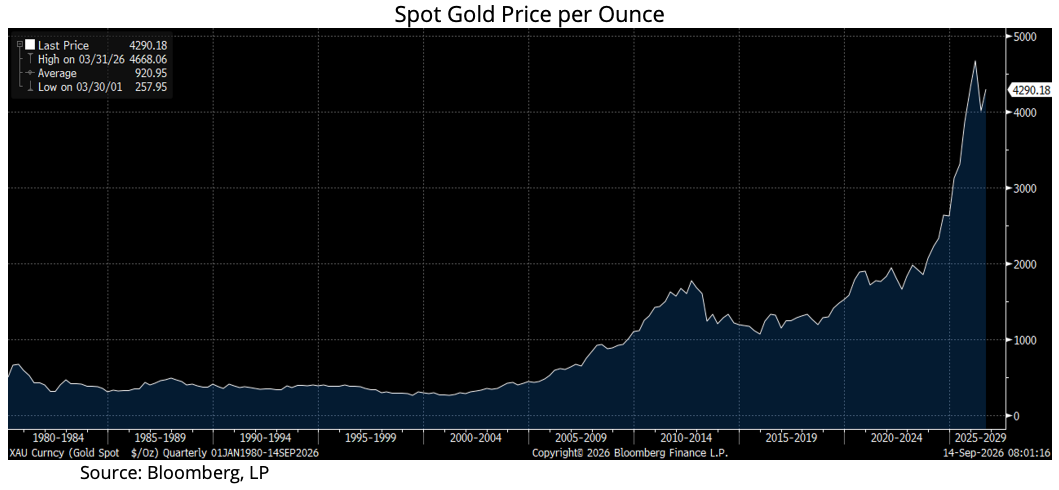
In any case, the notion that the US treasury will readily be able to sell its bonds around the world is being tested. There is no immediate replacement, but many entities are seeking to diversify their holdings, with gold among the beneficiaries. While its price has declined a bit in recent weeks, gold is currently trading at around $4,300 per ounce. This is more than double the price of two years ago.
AI Slowdown?
According to the Federal Reserve Bank of Atlanta [1], AI and related spending has contributed a large share of the growth in the US economy over the last several years. Other studies have largely confirmed that without the push from AI, US GDP growth would have been materially slower since 2024, perhaps as much as 50% slower. Most of this contribution has come from capital spending on things such as data centers and purchases of computing capacity in the form of chips and so forth.
Recently, notable headwinds have arisen that call the continued pace of growth into question. These include:
Growing grass-roots resistance to data-centers, especially near communities where concerns over noise, water and electricity consumption have become paramount.
A growing concern from legislators and regulators that AI needs to have stronger guardrails to avoid malign actors or even misaligned AI agents to produce widespread harm.
The rapid rise in the capabilities of free or low-cost open-source models, especially from China, to slow the growth in user-demand for the so-called frontier models, including those sold by OpenAI and Anthropic.
All three of these forces have raised serious questions about the financial prospects for these companies. Both Anthropic and OpenAI have been considering IPOs that would value them at more than $1 trillion. Those plans are now being reconsidered.
The iShares AI Innovation and Tech Active ETF (BAI) is down nearly 20% from its all-time high reached in June. Nvidia has announced significant investment into models and platforms that are largely independent of the large US AI forms. More importantly, business are spending heavily on AI, but a recent study from the NBER surveyed of almost 6,000 business executives and found that “executives report little own-firm impact of AI over the last 3 years, with nine-in-ten reporting no impact on employment or productivity.”[2] Businesses have been spending on AI because they feel they have to, but they acknowledge, so far, there is little to show for it outside some specific niches such as coding.
Businesses will continue to invest in AI, but unless some real gains appear, that spending is likely to slow significantly, and will be applied more strategically rather than being blindly slapped on to existing business processes. AI is going to have to earn its way into the boardroom. So far, it’s been mostly hype.
Summary
As has been the case all summer, the case for AI dominance and expansion has started to come under serious scrutiny. The war between the US and Iran continues to grind on, and even to expand as Iran-aligned parties such as the Houthis have become far more aggressive with non-combatant states such as Saudi Arabia. Debt and deficits are growing inexorably. And the Fed is effectively painted into a corner. There is almost no indicator that is leading toward lower interest rates. This is notwithstanding the President’s claim that because the US economy is growing while others are not, he believes the US should have interest rates of 1%. With all due respect to the President, that’s not how it works.
If you haven’t done so already, it is time to take seriously the risks to your clients’ investment portfolios.
There is a well-established playbook for this type of environment. Protect your capital and look for investments that generate current cash income. Trading headlines or social media posts is contrary to prudent risk management. Carefully evaluate your risk exposures and position yourself to not get caught offsides if conditions deteriorate further.
Please contact us to explore how RISR and FIXP might fit into your overall strategy, to help you manage risk while generating an attractive current yield.
[1] https://www.stlouisfed.org/on-the-economy/2026/jan/tracking-ai-contribution-gdp-growth
[2] https://www.nber.org/system/files/working_papers/w34836/w34836.pdf
Performance
Portfolio Applications
We believe RISR and FIXP can provide attractive, thematic strategies that provide strong correlation benefits for both fixed income and equity portfolios. They can be utilized as part of a core holdings for diversified portfolios or as an overlay to manage the risks of fixed income portfolios. RISR can be used as a macro hedge against rising interest rates with less exposure to equity beta and negative correlation to fixed income beta. The underlying bonds are all U.S. agency credit that are guaranteed by FNMA, FHLMC or GNMA. Also, timing is on our side as the strategy generates current income if interest rates were to remain within a trading range. FIXP offers a broadly diversified exposure to multiple sectors of the fixed income markets in an algorithmically optimized manner.
Please contact us to explore how RISR and FIXP can be utilized as a unique tool to adjust your portfolio allocations in the current high volatility environment.
| Yung Lim | Dean Smith | George Lucaci |
|---|---|---|
| Chief Executive Officer | Chief Strategist and Marketing Officer | Global Head of Distribution |
| Chief Investment Officer | RISR Portfolio Manager | |
| ylim@foliobeyond.com | dsmith@foliobeyond.com | glucaci@foliobeyond.com |
| 917-892-9075 | 914-523-2180 | 908-723-3372 |
This material must be preceded or accompanied by a prospectus. For a copy of the prospectus please click here for RISR and here for FIXP.
Investments involve risk. Principal loss is possible. Unlike mutual funds, ETFs trade at a premium or discount to their net asset value. The fund is new and has limited operating history to judge fund risks. The value of MBS IOs is more volatile than other types of mortgage related securities. They are very sensitive not only to declining interest rates, but also to the rate of prepayments. MBS IOs involve the risk that borrowers default on their mortgage obligations or the guarantees underlying the mortgage-backed securities will default or otherwise fail and that, during periods of falling interest rates, mortgage-backed securities will be called or prepaid, which result in the Fund having to reinvest proceeds in other investments at a lower interest rate.
The Fund’s derivative investments have risks, including the imperfect correlation between the value of such instruments and the underlying assets or index; the loss of principal, including the potential loss of amounts greater than the initial amount invested in the derivative instrument. The value of the Fund’s investments in fixed income securities (not including MBS IOs) will fluctuate with changes in interest rates. Typically, a rise in interest rates causes a decline in the value of fixed income securities owned indirectly by the Fund. Please see the prospectus for a complete description of principal risks.
FIXP Risks
Underlying ETFs Risks. The Fund will incur higher and duplicative expenses because it invests in underlying ETFs, including Bond Sector ETFs and broad-based bond ETFs (collectively, “Underlying ETFs”). There is also the risk that the Fund may suffer losses due to the investment practices of the Underlying ETFs. The Fund will be subject to substantially the same risks as those associated with the direct ownership of securities held by the Underlying ETFs.
Fixed Income Risk. The prices of fixed income securities respond to economic developments, particularly interest rate changes, as well as to changes in an issuer's credit rating or market perceptions about the creditworthiness of an issuer. In general, the market price of fixed income securities with longer maturities will increase or decrease more in response to changes in interest rates than shorter-term securities.
Option Overlay Risk. The Fund's use of options involves various risks, including the risk that the options strategy may not provide the desired increase in income or may result in losses. Selling call and put options exposes the Fund to potentially significant losses if market movements are unfavorable. The Fund may also experience additional volatility and risk due to changes in implied volatility (the market's forecast of future volatility), strike prices, and market conditions. The Fund may sell options on instruments other than the Fund's Bond Sector ETFs. This can expose the Fund to the risk that options can vary in price in ways that do not correspond to the Bond Sector ETFs held by the Fund, so called basis-risk.
Interest Rate Risk. Generally, the value of fixed income securities will change inversely with changes in interest rates. As interest rates rise, the market value of fixed income securities tends to decrease. Conversely, as interest rates fall, the market value of fixed income securities tends to increase.
New Fund Risk. The Fund is a recently organized management investment company with no operating history. As a result, prospective investors do not have a track record or history on which to base their investment decisions.
Diversification does not eliminate the risk of experiencing investment losses.
Index Definitions
Bloomberg Barclays US Aggregate Bond Index: A broad-based benchmark that measures the investment grade, US dollar-denominated, fixed-rate taxable bond market. The index includes Treasuries, government-related and corporate securities, MBS (agency fixed-rate and hybrid ARM pass-throughs), ABS and CMBS (agency and non-agency).
US Treasury 7-10 Yr Bond Inversed Index: ICE U.S. Treasury 7-10 Year Bond 1X Inverse Index is designed to provide the inverse of the daily return of the ICE U.S. Treasury 7-10 Year Bond Index (IDCOT7). ICE U.S. Treasury 7-10 Year Bond Index tracks the performance of US dollar denominated sovereign debt publicly issued by the US government in its domestic market. Qualifying securities of the underlying index must have greater than or equal to seven years and less than 10 years remaining term to final maturity as of the rebalancing date, a fixed coupon schedule and an adjusted amount outstanding of at least $300 million.
S&P 500 Index: The S&P 500 Index, or Standard & Poor's 500 Index, is a market-capitalization-weighted index of 500 leading publicly traded companies in the U.S.
IBOXHY Index: iBoxx USD Liquid High Yield Total Return Index measures the USD denominated, sub-investment grade, corporate bond market. The index includes bonds with minimum 1 years to maturity,
minimum amount outstanding of USD 400 mil. Bond type includes fixed-coupon, step-up, bonds with
sinking funds, medium term notes, callable and putable bonds.
Definitions
Alpha: a return achieved above and beyond the return of a benchmark or proxy with a similar risk level.
Annualized Equivalent Yield: represents the annualized yield based on the most recent month of income distribution: (income distribution x 12 months)/price per share.
Basis Points (bps): Is a unit of measure used in quoting yields, changes in yields or differences between yields. One basis point is equal to 0.01%, or one one-hundredth of a percent of yield and 100 basis points equals 1%.
Beta measures: the volatility of a security or portfolio relative to an index. Less than one means lower volatility than the index; more than one means greater volatility.
Convexity: A measure of how the duration of a bond changes in correlation to an interest rate change. The greater the convexity of a bond the greater the exposure of interest rate risk to the portfolio.
Correlation: a statistic that measures the degree to which two securities move in relation to each other.
Coupon: is the annual interest rate paid on a bond, expressed as a percentage of the bond’s face value.
CUSIP: An identifier number that stands for the Committee on Uniform Securities Identification Procedures assigned to stocks and registered bonds in the United States and Canada.
Duration: measures a bond price’s sensitivity to changes in interest rates. The longer a bond’s duration, the higher its sensitivity to changes in interest rates and vice versa.
GNMA: Government National Mortgage Association
FNMA: Federal National Mortgage Association
FHLMC: Federal Home Loan Mortgage Corporation
Short Investment (Shorting): is a position that has been sold with the expectation that it will decrease in value, the intention being to repurchase it later at a lower price.
Distributed by Foreside Fund Services, LLC.