RISR & FIXP Commentary for March 2026
Click here for a pdf version of this commentary.
RISR Performance Summary
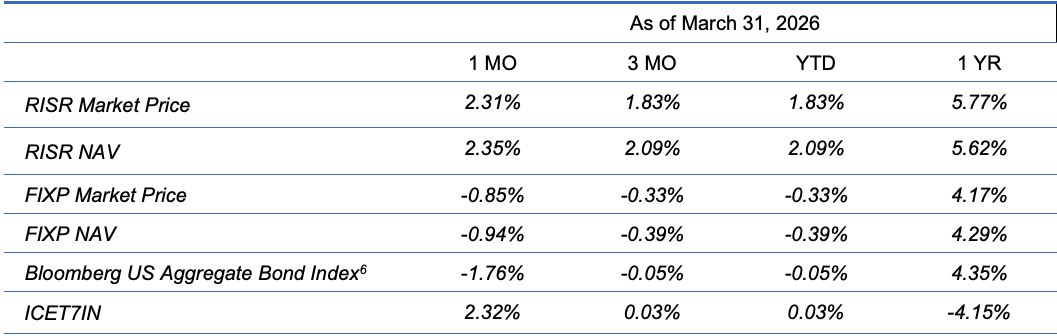
The FolioBeyond Alternative Income and Interest Rate Hedge ETF (ticker: RISR) returned 2.31% based on the closing market price (2.35% based on net asset value or “NAV”) in March. In comparison, the ICET7IN Index (US Treasury 7-Year Bond Inverse Index) returned 2.32% while the Bloomberg Barclays U.S. Aggregate Bond Index ("AGG") returned -1.76% during the same period.
The performance data quoted represents past performance. Past performance does not guarantee future results. The investment return and principal value of an investment will fluctuate so that an investor’s shares, when sold or redeemed, may be worth more or less than their original cost and current performance may be lower or higher than the performance quoted. Performance current to the most recent month-end can be obtained by calling 866-497-4963. Short-term performance, in particular, is not a good indication of the fund’s future performance, and an investment should not be made based solely on returns. Returns beyond 1 year are annualized.
A fund's NAV is the sum of all its assets less any liabilities, divided by the number of shares outstanding. The market price is the most recent price at which the fund was traded. The fund intends to pay out income, if any, monthly. There is no guarantee that these distributions will be made.
Total Expense Ratio is 1.04%.
For standardized performance click here.
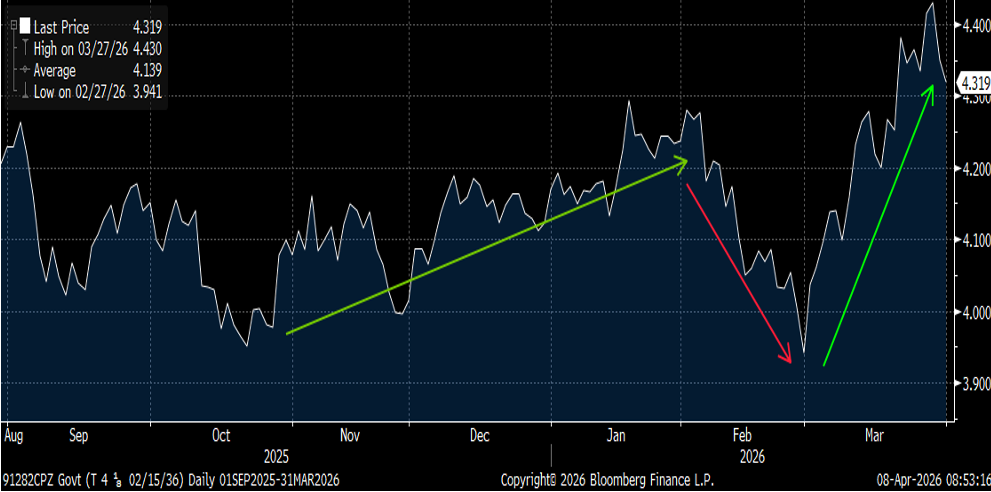
RISR’s strong performance in March was driven by a rise in interest rates that followed the initiation of the bombing of Iran by the combined militaries of the US and Israel on February 28. After hitting a new cycle low of 3.94% on Friday February 27, in the first week of March, 10-year Treasury rates immediately reversed course reaching 4.14% by Friday of that week. By the end of the last full week of the month, rates had climbed nearly 50 basis points to 4.43%. This was the highest level since mid-July 2025.
The initial impact of the aerial invasion was to cause an immediate jump in the price of petroleum and natural gas. The Gulf region produces roughly 1/5 of the world’s oil and gas, nearly all of which is shipped via tanker through the Strait of Hormuz. Over the course of the month, passage through the Strait ground to a near standstill, and there was a great deal of destruction of both production and refining capacity. This destruction was not limited to targets inside Iran by the joint activities of the US and Israel. Iran reacted by launching ballistic missile and drone attacks on facilities in Saudi Arabia, Kuwait, UAE and Qatar.
Not surprisingly, oil prices spiked by more than 50%, topping $100/bbl for the first time since Russia’s invasion of Ukraine in 2022, and for only the third time ever. By the end of the month, gasoline at US stations had topped $4.00/gallon nationally, and even higher in California.
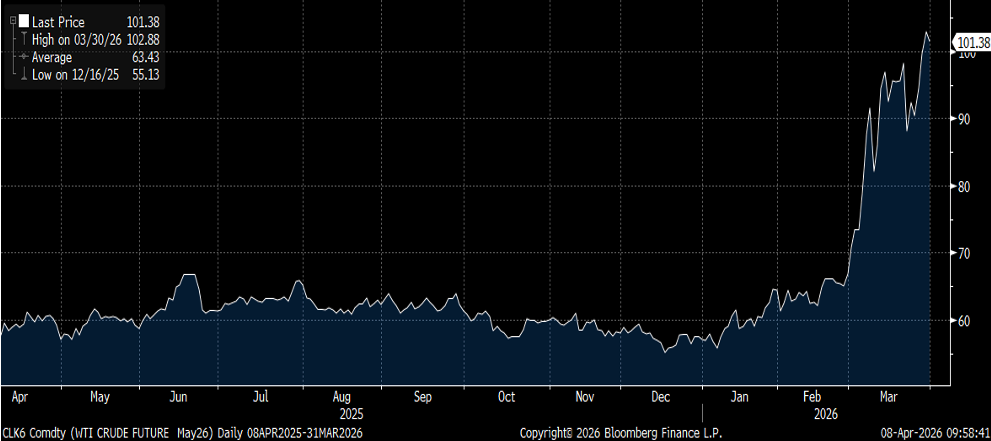
Discussion in markets naturally turned to the potential for higher inflation, and the demise of any potential Fed rate cuts for the balance of 2026, at least.
Financial market news during the month was naturally dominated by war activities and expectations about scope and duration. But there were other economically significant events during the month. The Federal Reserve, as expected, left the Fed Funds rate unchanged at 3.75% at their March 16-17 meeting. In addition to citing impacts from the war, Fed Chair Powell pointed to a relative stable unemployment rate that now stands at 4.4%, and incipient but mild (to his mind) inflationary pressures. He said the FOMC assessed that risks to inflation and unemployment were more or less balanced. Whereas in the prior meeting, there were two dissenting votes favoring a 25bps rate cut, at the current meeting, only Miran, the President’s man on the inside, dissented. In all likelihood, the Fed is on indefinite hold, barring a meaningful deterioration in labor market conditions.
To that point, markets were surprised by a large -92,000 February job loss (prior to the inception of the war) which was reported on March 6. This compared to an expectation for a gain of 55,000, and a gain of 130,000 in January, later revised to an even stronger 160,000. Nevertheless, the unemployment rate barely increased to 4.4% despite some large layoffs that were announced, principally among companies in the technology sector. The commonly heard expression to describe the job market “No hire-no fire.” So, companies are not adding to head-count, but neither are they reducing head-count across a wide range of sectors. On balance job losses in government and tech, are being offset by job gains in health care.
All of these factors combined to push rates materially higher across the entire yield curve, with 2-year through 30-year rates increasing between 35-40 bps. Thus, the forceful economic slowdown/AI fears themed rally of February was reversed and then some in March.
10-Year Treasury Yield – March Reversal of the February Reversal
Mortgage rates, which had slipped a little below 6% in February, increased materially to end the month at around 6.45%. As we have noted in prior commentaries, RISR’s portfolio consists principally of mortgage loans with interest rates that are still far “out of the money” for refinance. It would require a drop in mortgage rates of 150 bps or more to have a significant effect on prepayment rates for most of our holdings.
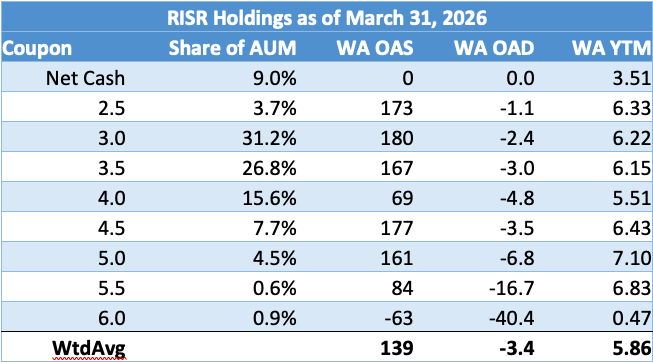
· WA OAS (Weighted Average Option-Adjusted Spread): The measurement of the spread between a fixed-income security rate and the risk-free rate of return (typically the LIBOR or Treasury curve) which is then adjusted to take into account an embedded option. It represents the compensation for credit, liquidity, and volatility risks.
· WA OAD (Weighted Average Option-Adjusted Duration): A calculation of the portfolio's price sensitivity to changes in interest rates, accounting for the fact that expected cash flows may change as interest rates change due to embedded options (such as prepayments in MBS). An OAD of 1.0 indicates a 1% price change for every 100 bps move in rates.
· WA YTM (Weighted Average Yield to Maturity): The percentage rate of return anticipated on a portfolio if all constituent securities are held until their maturity date, assuming all payments are made as scheduled and reinvested at the same rate. It is the internal rate of return (IRR) of the portfolio's cash flows.
RISR saw capital inflows of around $15 million in March, which was about 20% greater than the average for the last 12 months. In total, Assets Under Management have increased by about 60% in the last 12 months and now stand at above $210 million.
FIXP Performance Summary
FolioBeyond’s Enhanced Fixed Income Premium ETF (ticker: “FIXP”) seeks to provide income and, secondarily, long-term capital appreciation. The Fund invests in a portfolio of ETFs representing certain sectors of the fixed income market. In addition, the Fund seeks to generate additional income by writing options on these same ETFs, or other ETFs we believe have attractive prices and desirable correlation and volatility characteristics.
For the month of March, FIXP returned -0.85% (-0.94% based on NAV). There were no reallocations during the month, aside from those caused by differential performance.
FIXP’s performance was driven principally by under-performance of REM, an ETF that holds mortgage REITS. The selloff in interest rates, described above combined with widening mortgage and credit spreads were the factors that drove the underperformance. It is worth noting, however, that much of that under-performance was offset by the strong performance of RISR, for largely the same reasons. This demonstrates the benefits of FIXP’s allocation algorithm, even during a period in which many fixed income strategies would have exhibited poor performance. Option positions did not contribute materially positively or negatively in March.
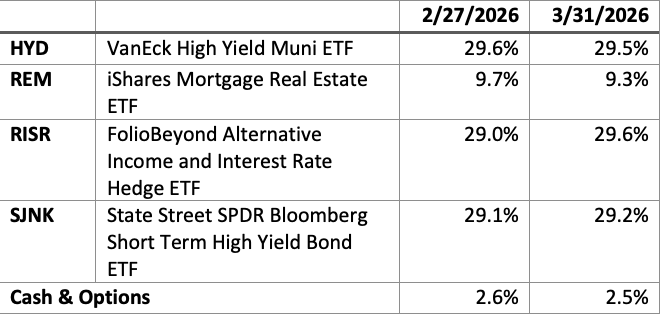
The fund’s holding weights are produced by FolioBeyond’s dynamic reallocation model. Changes are made from a universe of 24 economically diverse fixed income ETFs, based on volatility, momentum, yield, default risk, and other factors and occur based on market observations rather than a fixed schedule.
The performance data quoted represents past performance. Past performance does not guarantee future results. The investment return and principal value of an investment will fluctuate so that an investor’s shares, when sold or redeemed, may be worth more or less than their original cost and current performance and may be lower or higher than the performance quoted. Performance current to the most recent month-end can be obtained by calling 866-497-4963. Short-term performance, in particular, is not a good indication of the fund’s future performance, and an investment should not be made based solely on returns. Returns beyond 1 year are annualized.
A fund's NAV is the sum of all its assets less any liabilities, divided by the number of shares outstanding. The market price is the most recent price at which the fund was traded. The fund intends to pay out income, if any, monthly. There is no guarantee that these distributions will be made.
Total Expense Ratio is 1.03%.
For FIXP standardized performance and fund holdings click here.
The allocation model that FIXP uses has been running for private clients and model portfolios for more than three years, and we are very excited to be bringing this advanced algorithm to ETF investors. Please reach out to us to learn more and to obtain detailed information and fund documents.
Market Review and Outlook
Any expectations about the economy and financial markets for the balance of 2026 will depend significantly on the how the war between US/Isreal and Iran unfolds. After 5 weeks of incredible bombardment of military and civilian targets by both sides, a kind of stalemate has been reached. As of this writing, the US and Iran have entered into a fragile 2-week cease-fire. Unfortunately, based on news reports, it seems the two sides have wholly different understandings about the terms of that cease-fire. And Israel claims not to be bound by either side’s terms.
As far as the impacts on the global economy so far, it is clear that for many crucial products’ prices will be elevated and supplies will be curtailed for the foreseeable future. This is true not only for crude oil, but for many other commercial inputs including LNG and by-products thereof including fertilizers, helium, medicines and plastics, to name a few.
Even if the cease-fire holds, or an actual truce is reached, the damage is done. Bombs have destroyed production facilities across the Gulf region, even among non-combatant states. It will take months or even years, in some cases, to rebuild them. This is a severe and greatly under-appreciated problem, with no short-term fix. Without adequate fertilizer, crops don’t get planted. And if crops don’t get planted, people starve. This is not hyperbole. There will be food shortages in many parts of the world this year and probably next. The only questions are how long and how bad it will get. No one knows at this point. And if the fighting resumes, it could get much, much worse. Several countries in Asia have already instituted rationing schemes for various products dependent on Middle East energy products.
Shipping through the Strait of Hormuz is a related but separate problem. Ports have been damaged or destroyed. Iran has also taken the position that, during the cease-fire, and perhaps indefinitely, it has authority over which ships pass through the Strait and on what terms. Again, there is no alternative to tanker traffic through the Strait for the movement of energy commodities from the Middle East to the rest of the world. Pipeline capacity is a fraction of the need.
The one thing that can be said with confidence is that prices for many goods will be higher than most observers expected earlier this year. Expectations for month-over-month reported inflation in April and possibly into May are coming in at around 1%. That is the equivalent of 12+% annualized. Based on the current situation, it is unlikely to maintain that pace for the full year. But inflation for 2026 will surely be higher than most forecasters had been projected just a few short weeks ago. And with higher inflation comes higher interest rates. This will affect housing, capital investment, and ultimately overall growth. One looks in vain for a silver lining.
In sum, the fallout from this conflict is going to affect the global economy for some time to come. No one knows the full extent of the damage. And no one can predict if the parties will be able to reach an enduring peace. Given the history of relations between the combatants, one could be forgiven for being skeptical.
Against this inflationary backdrop, the employment picture is very murky. The noise in the reported job numbers persisted in March. The table below shows the initial reports, and the subsequent revisions to the Non-Farm Payroll reports since the start of last year.
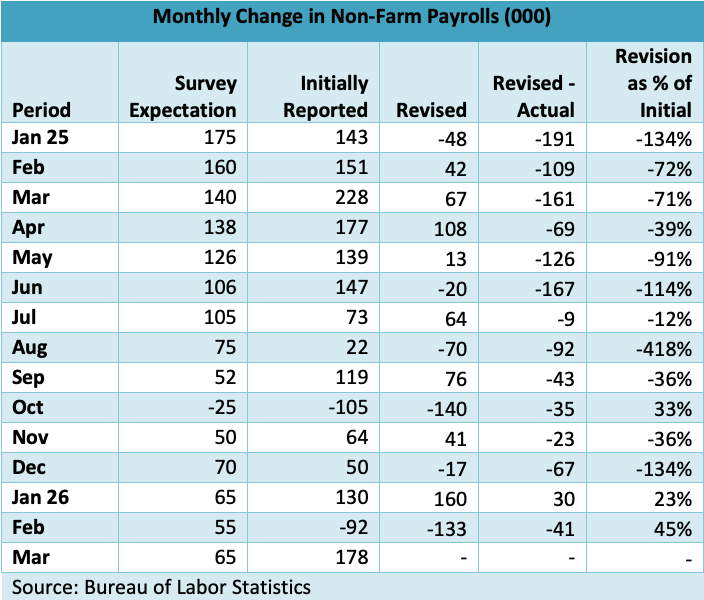
The magnitude of many of the revisions is remarkable. With the exception of January of this year, every revision has been lower. As we have noted previously there is no evidence of active manipulation of the data by BLS for political or other purposes. But something is wrong and needs to be addressed.
In any case, employment growth is slowing for a variety of reasons. Unfortunately, with the inflationary pressures from the Iran conflict and other factors, it will be difficult for the Fed to use interest rate policy to stimulate job growth. Given the structural changes in the economy and labor market it probably wouldn’t help even if they tried.
Summary
Geopolitical risk is always lurking in the background for any investment strategy. The current US Administration’s policy choices have clearly elevated those risks. This is not to make a value judgment on those policies. People can and will disagree on the costs and benefits of various courses of action. But for investors and investment advisors it is incumbent to set aside personal political preferences. The focus appropriately belongs on the range of potential outcomes and how to position one’s portfolio to achieve an acceptable degree of risk and potential reward. This in no way diminishes humanitarian concerns over military consequences. But one can be concerned and prudent at the same time. There is a well-established playbook for this type of environment. Protect your capital and look for investments that generate current cash income. Trying to trade the news or time the markets in such an environment is reckless in the extreme. The news will always be faster and more unpredictable that you are as an investor.
Please contact us to explore how RISR and FIXP might fit into your overall strategy, to help you manage risk while generating an attractive current yield.
Performance
Portfolio Applications
We believe RISR and FIXP can provide attractive, thematic strategies that provide strong correlation benefits for both fixed income and equity portfolios. They can be utilized as part of a core holdings for diversified portfolios or as an overlay to manage the risks of fixed income portfolios. RISR can be used as a macro hedge against rising interest rates with less exposure to equity beta and negative correlation to fixed income beta. The underlying bonds are all U.S. agency credit that are guaranteed by FNMA, FHLMC or GNMA. Also, timing is on our side as the strategy generates current income if interest rates were to remain within a trading range. FIXP offers a broadly diversified exposure to multiple sectors of the fixed income markets in an algorithmically optimized manner.
Please contact us to explore how RISR and FIXP can be utilized as a unique tool to adjust your portfolio allocations in the current high volatility environment.
| Yung Lim | Dean Smith | George Lucaci |
|---|---|---|
| Chief Executive Officer | Chief Strategist and Marketing Officer | Global Head of Distribution |
| Chief Investment Officer | RISR Portfolio Manager | |
| ylim@foliobeyond.com | dsmith@foliobeyond.com | glucaci@foliobeyond.com |
| 917-892-9075 | 914-523-2180 | 908-723-3372 |
This material must be preceded or accompanied by a prospectus. For a copy of the prospectus please click here for RISR and here for FIXP.
Investments involve risk. Principal loss is possible. Unlike mutual funds, ETFs trade at a premium or discount to their net asset value. The fund is new and has limited operating history to judge fund risks. The value of MBS IOs is more volatile than other types of mortgage related securities. They are very sensitive not only to declining interest rates, but also to the rate of prepayments. MBS IOs involve the risk that borrowers default on their mortgage obligations or the guarantees underlying the mortgage-backed securities will default or otherwise fail and that, during periods of falling interest rates, mortgage-backed securities will be called or prepaid, which result in the Fund having to reinvest proceeds in other investments at a lower interest rate.
The Fund’s derivative investments have risks, including the imperfect correlation between the value of such instruments and the underlying assets or index; the loss of principal, including the potential loss of amounts greater than the initial amount invested in the derivative instrument. The value of the Fund’s investments in fixed income securities (not including MBS IOs) will fluctuate with changes in interest rates. Typically, a rise in interest rates causes a decline in the value of fixed income securities owned indirectly by the Fund. Please see the prospectus for a complete description of principal risks.
FIXP Risks
Underlying ETFs Risks. The Fund will incur higher and duplicative expenses because it invests in underlying ETFs, including Bond Sector ETFs and broad-based bond ETFs (collectively, “Underlying ETFs”). There is also the risk that the Fund may suffer losses due to the investment practices of the Underlying ETFs. The Fund will be subject to substantially the same risks as those associated with the direct ownership of securities held by the Underlying ETFs.
Fixed Income Risk. The prices of fixed income securities respond to economic developments, particularly interest rate changes, as well as to changes in an issuer's credit rating or market perceptions about the creditworthiness of an issuer. In general, the market price of fixed income securities with longer maturities will increase or decrease more in response to changes in interest rates than shorter-term securities.
Option Overlay Risk. The Fund's use of options involves various risks, including the risk that the options strategy may not provide the desired increase in income or may result in losses. Selling call and put options exposes the Fund to potentially significant losses if market movements are unfavorable. The Fund may also experience additional volatility and risk due to changes in implied volatility (the market's forecast of future volatility), strike prices, and market conditions. The Fund may sell options on instruments other than the Fund's Bond Sector ETFs. This can expose the Fund to the risk that options can vary in price in ways that do not correspond to the Bond Sector ETFs held by the Fund, so called basis-risk.
Interest Rate Risk. Generally, the value of fixed income securities will change inversely with changes in interest rates. As interest rates rise, the market value of fixed income securities tends to decrease. Conversely, as interest rates fall, the market value of fixed income securities tends to increase.
New Fund Risk. The Fund is a recently organized management investment company with no operating history. As a result, prospective investors do not have a track record or history on which to base their investment decisions.
Diversification does not eliminate the risk of experiencing investment losses.
Index Definitions
Bloomberg Barclays US Aggregate Bond Index: A broad-based benchmark that measures the investment grade, US dollar-denominated, fixed-rate taxable bond market. The index includes Treasuries, government-related and corporate securities, MBS (agency fixed-rate and hybrid ARM pass-throughs), ABS and CMBS (agency and non-agency).
US Treasury 7-10 Yr Bond Inversed Index: ICE U.S. Treasury 7-10 Year Bond 1X Inverse Index is designed to provide the inverse of the daily return of the ICE U.S. Treasury 7-10 Year Bond Index (IDCOT7). ICE U.S. Treasury 7-10 Year Bond Index tracks the performance of US dollar denominated sovereign debt publicly issued by the US government in its domestic market. Qualifying securities of the underlying index must have greater than or equal to seven years and less than 10 years remaining term to final maturity as of the rebalancing date, a fixed coupon schedule and an adjusted amount outstanding of at least $300 million.
S&P 500 Index: The S&P 500 Index, or Standard & Poor's 500 Index, is a market-capitalization-weighted index of 500 leading publicly traded companies in the U.S.
IBOXHY Index: iBoxx USD Liquid High Yield Total Return Index measures the USD denominated, sub-investment grade, corporate bond market. The index includes bonds with minimum 1 years to maturity,
minimum amount outstanding of USD 400 mil. Bond type includes fixed-coupon, step-up, bonds with
sinking funds, medium term notes, callable and putable bonds.
Definitions
Alpha: a return achieved above and beyond the return of a benchmark or proxy with a similar risk level.
Annualized Equivalent Yield: represents the annualized yield based on the most recent month of income distribution: (income distribution x 12 months)/price per share.
Basis Points (bps): Is a unit of measure used in quoting yields, changes in yields or differences between yields. One basis point is equal to 0.01%, or one one-hundredth of a percent of yield and 100 basis points equals 1%.
Beta measures: the volatility of a security or portfolio relative to an index. Less than one means lower volatility than the index; more than one means greater volatility.
Convexity: A measure of how the duration of a bond changes in correlation to an interest rate change. The greater the convexity of a bond the greater the exposure of interest rate risk to the portfolio.
Correlation: a statistic that measures the degree to which two securities move in relation to each other.
Coupon: is the annual interest rate paid on a bond, expressed as a percentage of the bond’s face value.
CUSIP: An identifier number that stands for the Committee on Uniform Securities Identification Procedures assigned to stocks and registered bonds in the United States and Canada.
Duration: measures a bond price’s sensitivity to changes in interest rates. The longer a bond’s duration, the higher its sensitivity to changes in interest rates and vice versa.
GNMA: Government National Mortgage Association
FNMA: Federal National Mortgage Association
FHLMC: Federal Home Loan Mortgage Corporation
Short Investment (Shorting): is a position that has been sold with the expectation that it will decrease in value, the intention being to repurchase it later at a lower price.
Distributed by Foreside Fund Services, LLC.