RISR & FIXP Commentary for February 2026
Click here for a pdf version of this commentary.
RISR Performance Summary
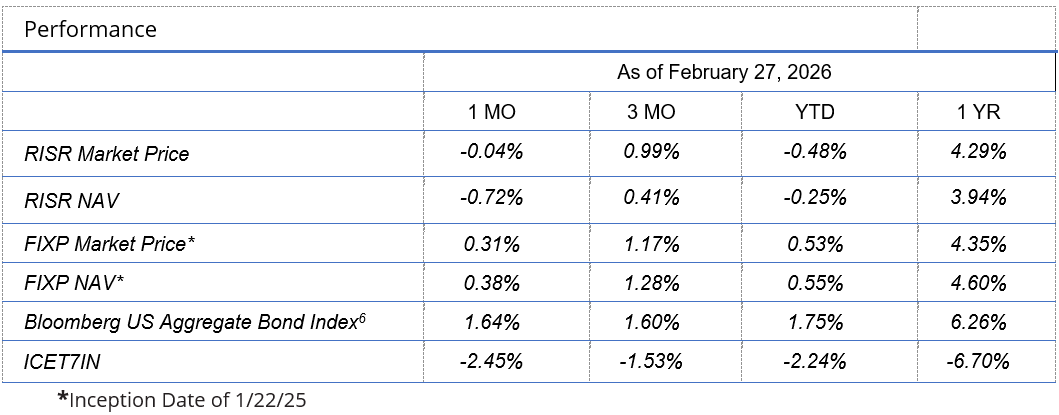
The FolioBeyond Alternative Income and Interest Rate Hedge ETF (ticker: RISR) returned ‑0.04% based on the closing market price (-0.72% based on net asset value or “NAV”) in February. In comparison, the ICET7IN Index (US Treasury 7-Year Bond Inverse Index) returned -2.45% while the Bloomberg Barclays U.S. Aggregate Bond Index ("AGG") returned 1.64% during the same period.
The performance data quoted represents past performance. Past performance does not guarantee future results. The investment return and principal value of an investment will fluctuate so that an investor’s shares, when sold or redeemed, may be worth more or less than their original cost and current performance may be lower or higher than the performance quoted. Performance current to the most recent month-end can be obtained by calling 866-497-4963. Short-term performance, in particular, is not a good indication of the fund’s future performance, and an investment should not be made based solely on returns. Returns beyond 1 year are annualized.
A fund's NAV is the sum of all its assets less any liabilities, divided by the number of shares outstanding. The market price is the most recent price at which the fund was traded. The fund intends to pay out income, if any, monthly. There is no guarantee that these distributions will be made.
Total Expense Ratio is 1.04%.
For standardized performance click here.
RISR produced a small negative return in February as the steady rise in rates since last October was sharply and suddenly reversed during the month. MBS IO prices were further adversely impacted by increases in model-implied prepayment rates that overshot the actual observed speeds. While there has been a modest uptick in prepayment speeds since the beginning of the year, rates remain at depressed levels because the vast majority of existing fixed rate mortgage are still far out of the money for refinancing with 70% of existing fixed-rate loans having rates under 5%. The industry standard models, including YieldBook and Bloomberg’s BAM, are projecting faster speeds even on loans with low interest rates. It may take a few weeks or even months for these models to realign with observed speeds.
Three catalysts hit the market back-to-back-to-back in February. First, a series of softer inflation prints early in the month gave markets the go ahead to price in additional Fed rate cuts, which had been coming into increasing doubt. Second, the Supreme Court rejected outright the Trump administration’s broad based IEEPA tariffs that had been imposed last April. This removed another leg from the re-inflationary stool. Third, there was a growing sense that widespread adoption of AI was going to have adverse effects on economic growth, profitability and employment. In this narrative-driven market, the immediate catalyst for the change in outlook over AI was a viral Substack post that laid out a gloomy forecast for jobs and business disruption coming from AI. The authors of that post posed it as a thought experiment rather than an actual forecast, but the market ran with it anyway. It was later revealed that the post was co-authored by analysts at a hedge fund with short positions in tech. Critiques of the analysis followed, including an equally viral post prepared by hedge fund Citadel, but by then the damage was done. It is a sign of the fragility of market confidence, and the power of social media, when a Substack post promoted on X can induce tens or even hundreds of billions of dollars in market value destruction.
10-Year Treasury Yield – Sharp Reversal in February
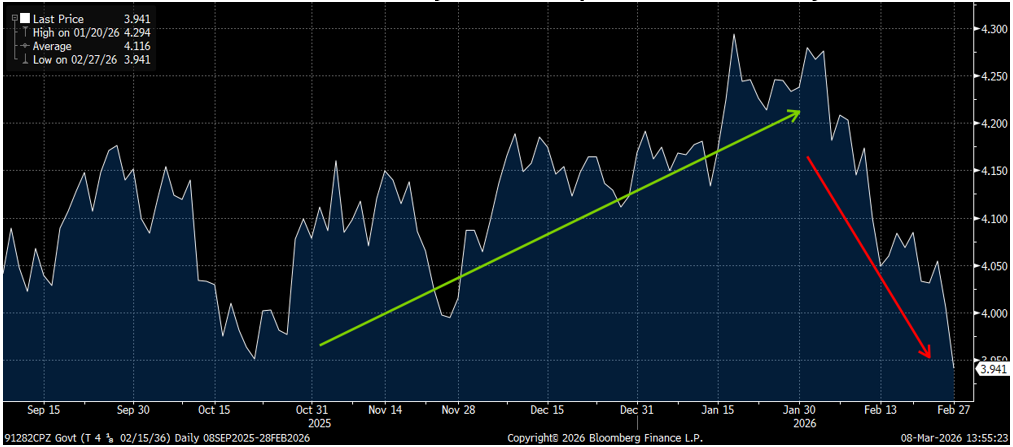
By month-end, the 10-year benchmark stood at 3.95%, basically at the prior cyclical low seen in mid-October of last year.
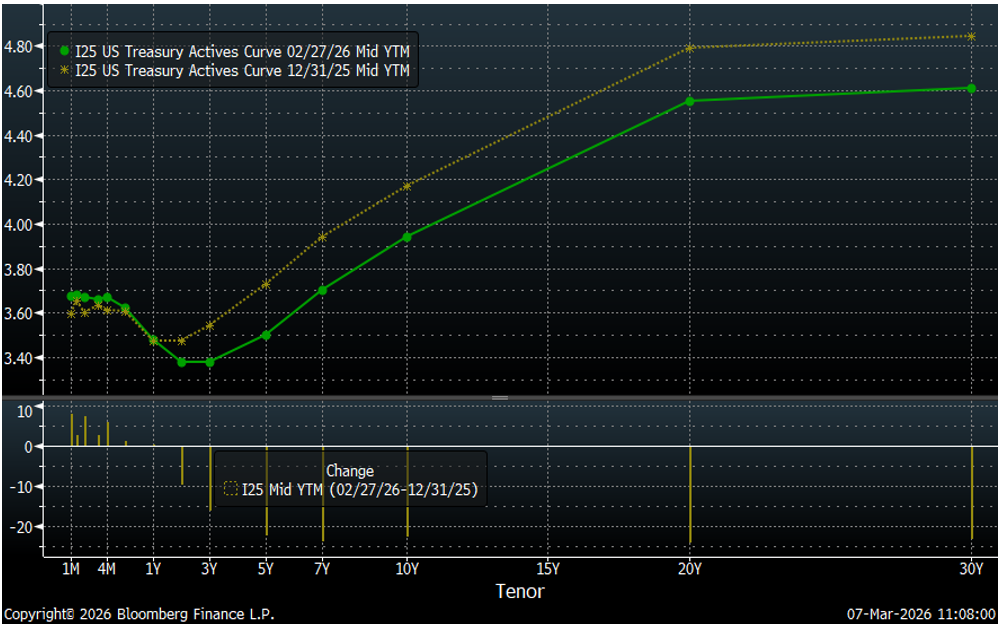
The bond market rally affected rates across the entire yield curve, although the 2s/10s steepened by around 15 bps. This is further evidence of the market suddenly concluding that rate cuts were back on the table. While one should always be cautious about arguing with the market, it is hard to reconcile: 1) a belief that AI is going to disrupt essentially everything, with 2) a belief that cuts in the Fed Funds rate will have any material impact on such an unprecedented technical revolution. But when the only tool one has is the FOMC, every problem appears to be solvable with rate cuts.
Because of this, mortgage rates in some markets slipped below 6% for the first time since Q3 2022. While this spurred a mini-refi boom-let, mortgage prepayment speeds remain suppressed nationally, as homeowners with very low interest rate mortgages obtained in the period immediately following Covid, are “trapped” in that they would face materially higher payments if they were to sell and buy a new home, even if the value of that home was close to or the same as their current residence.
As we have noted in prior commentaries, RISR’s portfolio consists principally of mortgage loans with interest rates that are still far “out of the money” for refinance. Even if mortgage rates were to stay a bit below 6% (which they won’t—see below), it would only affect a very small percentage of our holdings.
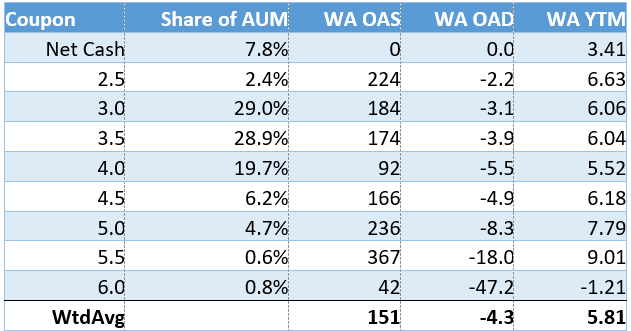
· WA OAS (Weighted Average Option-Adjusted Spread): The measurement of the spread between a fixed-income security rate and the risk-free rate of return (typically the LIBOR or Treasury curve) which is then adjusted to take into account an embedded option. It represents the compensation for credit, liquidity, and volatility risks.
· WA OAD (Weighted Average Option-Adjusted Duration): A calculation of the portfolio's price sensitivity to changes in interest rates, accounting for the fact that expected cash flows may change as interest rates change due to embedded options (such as prepayments in MBS). An OAD of 1.0 indicates a 1% price change for every 100 bps move in rates.
· WA YTM (Weighted Average Yield to Maturity): The percentage rate of return anticipated on a portfolio if all constituent securities are held until their maturity date, assuming all payments are made as scheduled and reinvested at the same rate. It is the internal rate of return (IRR) of the portfolio's cash flows.
RISR saw capital inflows of around $2.5 million in February.
FIXP Performance Summary
FolioBeyond’s Enhanced Fixed Income Premium ETF (ticker: “FIXP”) seeks to provide income and, secondarily, long-term capital appreciation. The Fund invests in a portfolio of ETFs representing certain sectors of the fixed income market. In addition, the Fund seeks to generate additional income by writing options on these same ETFs, or other ETFs we believe have attractive prices and desirable correlation and volatility characteristics.
For the month of February, FIXP returned 0.31% (0.38% based on NAV). There were no reallocations during the month, aside from those caused by differential performance.
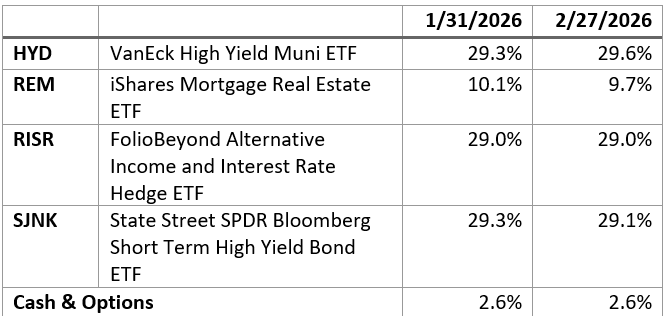
FIXP’s performance was driven principally by a strong outperformance of HYD, which is an ETF that invests in high yield municipal bonds, and was up 1.3% for the month. Option positions also contributed around 10 bps in February.
The fund’s holding weights are produced by FolioBeyond’s dynamic reallocation model. Changes are made from a universe of 24 economically diverse fixed income ETFs, based on volatility, momentum, yield, default risk, and other factors and occur based on market observations rather than a fixed schedule.
The performance data quoted represents past performance. Past performance does not guarantee future results. The investment return and principal value of an investment will fluctuate so that an investor’s shares, when sold or redeemed, may be worth more or less than their original cost and current performance and may be lower or higher than the performance quoted. Performance current to the most recent month-end can be obtained by calling 866-497-4963. Short-term performance, in particular, is not a good indication of the fund’s future performance, and an investment should not be made based solely on returns. Returns beyond 1 year are annualized.
A fund's NAV is the sum of all its assets less any liabilities, divided by the number of shares outstanding. The market price is the most recent price at which the fund was traded. The fund intends to pay out income, if any, monthly. There is no guarantee that these distributions will be made.
Total Expense Ratio is 1.03%.
For FIXP standardized performance and fund holdings click here.
The allocation model that FIXP uses has been running for private clients and model portfolios for more than three years, and we are very excited to be bringing this advanced algorithm to ETF investors. Please reach out to us to learn more and to obtain detailed information and fund documents.
Market Review and Outlook
The unexpected invasion of Iran by the US and Israel, has injected a new and significant dimension of chaos and uncertainty into the financial outlook for 2026. As we always try to do, we will keep our personal political opinions about this out of this discussion and instead will focus on the implications for investors.
The immediate and most obvious impact is on oil prices, and how that will affect inflation. In the immediate aftermath of the aerial bombardment, oil prices jumped significantly. As the conflict has continued into early March, additional stress in the oil markets has arisen due to the cancellation of insurance for oil containers transiting the Strait of Hormuz. The lack of insurance is every bit as effective in shutting down container shipping as any direct military threat would be. The longer it stays impassable, the higher oil prices can be expected to climb. As of the date of this writing, markets have topped $100 for Brent crude, and materially higher prices cannot be ruled out. This compares to a price of around $70 immediately prior to the invasion.
Bond markets responded as one would expect. The benchmark 10-year treasury jumped by 20 bps in the week that followed, and now stands at 4.17% up from its recent low of 3.95%. The break-even inflation rate from the TIPS[1] market increased by more than 130 bps. Expectations of Fed rate cuts in 2026 are being sharply reduced. The inflationary pressures from sustained higher oil prices have forecasters recalling prior periods of supply side shocks such as the oil shocks of the 1970s. Oil is a direct or indirect input into almost every manufactured product as well as transportation services including truck and rail shipping and air transport. As fictional Landman Tommy Norris said, “It’s in everything.”
Against this inflationary backdrop, the employment picture is very murky. A surprisingly strong print of 125 thousand new jobs in February, was reversed by an equally surprising drop of 92 thousand jobs in March. Something very unusual is going on in the labor market, or at the Bureau of Labor Statistics. Or, more likely, both.
With regard to the BLS, there is no evidence of active manipulation of the data for political or other purposes. The far more prosaic explanation is their data gathering and analysis has simply not kept up with changes in the labor markets. For example, much of their data is gathered via surveys. The response rate to these surveys, from both businesses and households has declined sharply over the last 10 years or so, and especially since the pandemic. In addition, the workforce has changed materially with gig work, remote consulting, and other non-traditional formats making up an increasing share of the labor force. Finally the massive inflows and outflow of undocumented workers, especially from Latin America, has muddied the picture further. It is bordering on impossible for the BLS to determine with any precision exactly how many workers are employed in the US at a given time. That difficulty is reflected in the monthly volatility in the reports, as well as in the very large revisions that follow in subsequent months.
Despite those caveats, it is clear that job growth has slowed in recent quarters. Even so, the unemployment rate remains anchored in the low- to mid-four percent range. Historically, that is considered full-employment, and attempts by the Fed to use monetary policy to force it lower would cause inflationary pressures. This has been exactly the argument made by those Fed members who have voted against further rate cuts in the last handful of meetings. With the confirmation of incoming Fed Chair Walsh now blocked over the president’s legal squabbles with current chair Powell, one should not expect a radical change over the next several meetings.
Meanwhile, the exuberance over AI induced bounty that dominated stock markets in 2026, has been almost entirely revised into near panic doom-saying, regarding the potential for job and business model destruction from AI. AI and tech stocks more broadly have fallen off a cliff, and AI exuberance has morphed into AI despair. Both extremes are over-done.
What is largely lost in these discussions over AI disruption is an appreciation for how slowly large institutions adopt new technologies. Not in a superficial way like chatbots for customer support. Those kinds of changes are fairly trivial. But how AI will be integrated deeply into business processes, manufacturing and distribution, supply chain management, and so much more. The current crop of LLMs are indeed extraordinarily impressive for a variety of coding and software development tasks. But Walmart, Ford, Pfizer, Caterpillar, Boeing, Pepsico, and countless other massive global corporations are many years away from deeply deploying AI into their core business processes. Such businesses are naturally conservative about wholesale changes, and LLMs will need to have significant improvements in reliability, explainability and coherence before they can be adopted. They are still largely black boxes from the perspective of business leaders.
A number of companies have announced large-scale layoffs of workers, blaming AI. But that is almost entirely a smokescreen for businesses right-sizing after rapid growth in workforces after the pandemic. In fact, job demand for developers has increased over the last few quarters, as tech businesses have discovered the improving capabilities of coding agents such as Claude Code and GPT-Codex require a great deal of supervision and instruction to perform well. The “AI is going to eat the economy” narrative is a fantasy.
Summary
There is a prudent, well-established playbook for this type of environment. Protect your capital and look for investments that generate current cash income. Trying to trade the news or time the markets in such an environment is reckless in the extreme. The news will always be faster and more unpredictable that you are as an investor.
Please contact us to explore how RISR and FIXP might fit into your overall strategy, to help you manage risk while generating an attractive current yield.
[1] TIPS: Treasury Inflation Protected Securities
Portfolio Applications
We believe RISR and FIXP can provide attractive, thematic strategies that provide strong correlation benefits for both fixed income and equity portfolios. They can be utilized as part of a core holdings for diversified portfolios or as an overlay to manage the risks of fixed income portfolios. RISR can be used as a macro hedge against rising interest rates with less exposure to equity beta and negative correlation to fixed income beta. The underlying bonds are all U.S. agency credit that are guaranteed by FNMA, FHLMC or GNMA. Also, timing is on our side as the strategy generates current income if interest rates were to remain within a trading range. FIXP offers a broadly diversified exposure to multiple sectors of the fixed income markets in an algorithmically optimized manner.
Please contact us to explore how RISR and FIXP can be utilized as a unique tool to adjust your portfolio allocations in the current high volatility environment.
| Yung Lim | Dean Smith | George Lucaci |
|---|---|---|
| Chief Executive Officer | Chief Strategist and Marketing Officer | Global Head of Distribution |
| Chief Investment Officer | RISR Portfolio Manager | |
| ylim@foliobeyond.com | dsmith@foliobeyond.com | glucaci@foliobeyond.com |
| 917-892-9075 | 914-523-2180 | 908-723-3372 |
This material must be preceded or accompanied by a prospectus. For a copy of the prospectus please click here for RISR and here for FIXP.
Investments involve risk. Principal loss is possible. Unlike mutual funds, ETFs trade at a premium or discount to their net asset value. The fund is new and has limited operating history to judge fund risks. The value of MBS IOs is more volatile than other types of mortgage related securities. They are very sensitive not only to declining interest rates, but also to the rate of prepayments. MBS IOs involve the risk that borrowers default on their mortgage obligations or the guarantees underlying the mortgage-backed securities will default or otherwise fail and that, during periods of falling interest rates, mortgage-backed securities will be called or prepaid, which result in the Fund having to reinvest proceeds in other investments at a lower interest rate.
The Fund’s derivative investments have risks, including the imperfect correlation between the value of such instruments and the underlying assets or index; the loss of principal, including the potential loss of amounts greater than the initial amount invested in the derivative instrument. The value of the Fund’s investments in fixed income securities (not including MBS IOs) will fluctuate with changes in interest rates. Typically, a rise in interest rates causes a decline in the value of fixed income securities owned indirectly by the Fund. Please see the prospectus for a complete description of principal risks.
FIXP Risks
Underlying ETFs Risks. The Fund will incur higher and duplicative expenses because it invests in underlying ETFs, including Bond Sector ETFs and broad-based bond ETFs (collectively, “Underlying ETFs”). There is also the risk that the Fund may suffer losses due to the investment practices of the Underlying ETFs. The Fund will be subject to substantially the same risks as those associated with the direct ownership of securities held by the Underlying ETFs.
Fixed Income Risk. The prices of fixed income securities respond to economic developments, particularly interest rate changes, as well as to changes in an issuer's credit rating or market perceptions about the creditworthiness of an issuer. In general, the market price of fixed income securities with longer maturities will increase or decrease more in response to changes in interest rates than shorter-term securities.
Option Overlay Risk. The Fund's use of options involves various risks, including the risk that the options strategy may not provide the desired increase in income or may result in losses. Selling call and put options exposes the Fund to potentially significant losses if market movements are unfavorable. The Fund may also experience additional volatility and risk due to changes in implied volatility (the market's forecast of future volatility), strike prices, and market conditions. The Fund may sell options on instruments other than the Fund's Bond Sector ETFs. This can expose the Fund to the risk that options can vary in price in ways that do not correspond to the Bond Sector ETFs held by the Fund, so called basis-risk.
Interest Rate Risk. Generally, the value of fixed income securities will change inversely with changes in interest rates. As interest rates rise, the market value of fixed income securities tends to decrease. Conversely, as interest rates fall, the market value of fixed income securities tends to increase.
New Fund Risk. The Fund is a recently organized management investment company with no operating history. As a result, prospective investors do not have a track record or history on which to base their investment decisions.
Diversification does not eliminate the risk of experiencing investment losses.
Index Definitions
Bloomberg Barclays US Aggregate Bond Index: A broad-based benchmark that measures the investment grade, US dollar-denominated, fixed-rate taxable bond market. The index includes Treasuries, government-related and corporate securities, MBS (agency fixed-rate and hybrid ARM pass-throughs), ABS and CMBS (agency and non-agency).
US Treasury 7-10 Yr Bond Inversed Index: ICE U.S. Treasury 7-10 Year Bond 1X Inverse Index is designed to provide the inverse of the daily return of the ICE U.S. Treasury 7-10 Year Bond Index (IDCOT7). ICE U.S. Treasury 7-10 Year Bond Index tracks the performance of US dollar denominated sovereign debt publicly issued by the US government in its domestic market. Qualifying securities of the underlying index must have greater than or equal to seven years and less than 10 years remaining term to final maturity as of the rebalancing date, a fixed coupon schedule and an adjusted amount outstanding of at least $300 million.
S&P 500 Index: The S&P 500 Index, or Standard & Poor's 500 Index, is a market-capitalization-weighted index of 500 leading publicly traded companies in the U.S.
IBOXHY Index: iBoxx USD Liquid High Yield Total Return Index measures the USD denominated, sub-investment grade, corporate bond market. The index includes bonds with minimum 1 years to maturity,
minimum amount outstanding of USD 400 mil. Bond type includes fixed-coupon, step-up, bonds with
sinking funds, medium term notes, callable and putable bonds.
Definitions
Alpha: a return achieved above and beyond the return of a benchmark or proxy with a similar risk level.
Annualized Equivalent Yield: represents the annualized yield based on the most recent month of income distribution: (income distribution x 12 months)/price per share.
Basis Points (bps): Is a unit of measure used in quoting yields, changes in yields or differences between yields. One basis point is equal to 0.01%, or one one-hundredth of a percent of yield and 100 basis points equals 1%.
Beta measures: the volatility of a security or portfolio relative to an index. Less than one means lower volatility than the index; more than one means greater volatility.
Convexity: A measure of how the duration of a bond changes in correlation to an interest rate change. The greater the convexity of a bond the greater the exposure of interest rate risk to the portfolio.
Correlation: a statistic that measures the degree to which two securities move in relation to each other.
Coupon: is the annual interest rate paid on a bond, expressed as a percentage of the bond’s face value.
CUSIP: An identifier number that stands for the Committee on Uniform Securities Identification Procedures assigned to stocks and registered bonds in the United States and Canada.
Duration: measures a bond price’s sensitivity to changes in interest rates. The longer a bond’s duration, the higher its sensitivity to changes in interest rates and vice versa.
GNMA: Government National Mortgage Association
FNMA: Federal National Mortgage Association
FHLMC: Federal Home Loan Mortgage Corporation
Short Investment (Shorting): is a position that has been sold with the expectation that it will decrease in value, the intention being to repurchase it later at a lower price.
Distributed by Foreside Fund Services, LLC.