RISR & FIXP Commentary for April 2026
Click here for a pdf version of this commentary.
RISR Performance Summary
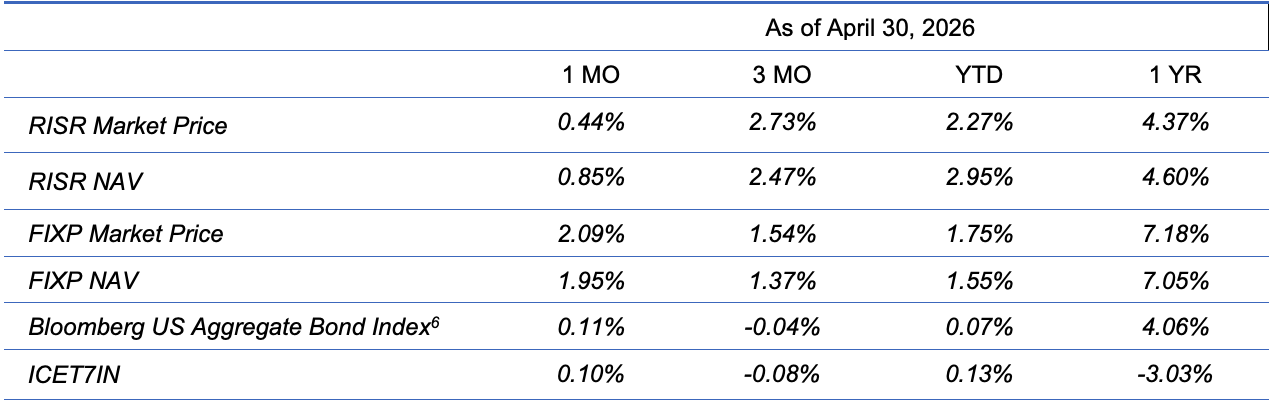
The FolioBeyond Alternative Income and Interest Rate Hedge ETF (ticker: RISR) returned 0.44% based on the closing market price (0.85% based on net asset value or “NAV”) in April. In comparison, the ICET7IN Index (US Treasury 7-Year Bond Inverse Index) returned 0.10% while the Bloomberg Barclays U.S. Aggregate Bond Index ("AGG") returned 0.11% during the same period.
The performance data quoted represents past performance. Past performance does not guarantee future results. The investment return and principal value of an investment will fluctuate so that an investor’s shares, when sold or redeemed, may be worth more or less than their original cost and current performance may be lower or higher than the performance quoted. Performance current to the most recent month-end can be obtained by calling 866-497-4963. Short-term performance, in particular, is not a good indication of the fund’s future performance, and an investment should not be made based solely on returns. Returns beyond 1 year are annualized.
A fund's NAV is the sum of all its assets less any liabilities, divided by the number of shares outstanding. The market price is the most recent price at which the fund was traded. The fund intends to pay out income, if any, monthly. There is no guarantee that these distributions will be made.
Total Expense Ratio is 1.04%.
For standardized performance click here.
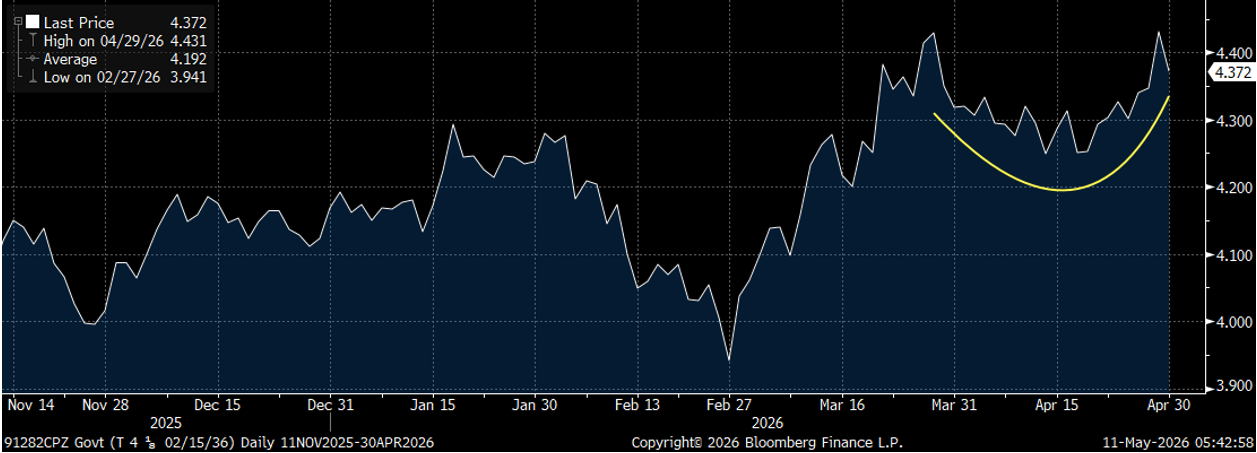
RISR’s performance in April was a reflection of the ebb and flow of positive and negative sentiment over the conflict between the US and Iran. During the first half of the month, bonds rallied and yields declined on expectations for an end to hostilities and a renewed flow of oil through the Strait of Hormuz. Those expectations reversed during the last two weeks as it became ever more clear that a resolution to the conflict was going to be much more difficult and time-consuming than many thought.
After falling by around 15 bps, rates ended the month close to where they began, with the 10-year yield just below 4.4%. Conflicting news stories and mixed messaging from the Trump Administration as well as the Iranian government, left investors confused about the path forward. This was made even worse by a blockade of all tanker traffic in and out of the Persian Gulf the President announced on April 13. Around the same time, he and other officials were claiming active hostilities had ended. Iran did not concur and continued to launch missile and drone attacks on its Gulf neighbors.
Yield on 10-Year US Treasury Bond
Under the pressure of rising oil prices and growing shortages of fossil fuel-based fertilizers, inflation reports are reflecting what businesses and consumers are already feeling. Month-over-month CPI (Consumer Price Index) came in at a shocking 0.9% (11.8% annualized). This was by far the highest MoM reading since June 2022. Year-over-year was less dramatic, but still above consensus forecasts at 3.4%, and almost a full percentage point above the prior month reading. PPI (Producer Price Index) which was released a few days later confirmed the effects of higher oil prices were affecting all areas of the economy.
Consequently, as virtually everyone expected, the FOMC elected to hold the Fed Funds rate steady at 3.75%. There was a bit of drama around the announcement, however. There were four dissenting votes. One, predictably, came from Stephen Miran, who voted for 25 bps cut. Three others, wanted to change the language of the statement issued by the Fed to make more clear their growing concerns about inflation. This is highly unusual. A final bit of drama was Powell’s announcement that he would be staying on as a Governor after his term as Chair expired, and Warsh replaces him. His stated reason was the ongoing uncertainty over the legal wranglings between the Fed and the White House. Powell aims to stay at the Fed until those matters are fully resolved, or his term as Governor ends in 2028—whichever comes first.
Not surprisingly, mortgage rates ended the month higher by almost 50bps, to close at 6.3%. Rates had briefly dipped below 6% near the start of the month, which some observers pointed to as a signal that briefly stimulated a mild increase in activity. A more likely explanation is that home buyers and sellers are finally coming to grips with the reality that a meaningful decline in mortgage rates is unlikely and are resigning themselves to this new reality. As we have noted previously, the bulk of US mortgages outstanding have interest rates below 4%. A brief dip below 6% is not the beacon some would like it to be.
Another technical factor that influenced mortgage and MBS markets in April was the release of a new model version of YieldBook. YieldBook is widely used suite of computational tools used by Wall Street traders, institutional investors, mortgage originators and others. Without getting into the details, it quickly became clear that this release was a significant revision vs. the prior version. And MBS trading volumes slowed materially as the markets digested this new information. The impact on RISR was mixed with some prices being reduced while others rose. As is common when major model revisions are released, it will take a few months for the impacts of these changes to be fully incorporated into prices and prepayment forecasts. We do not anticipate material impacts to our overall strategy.
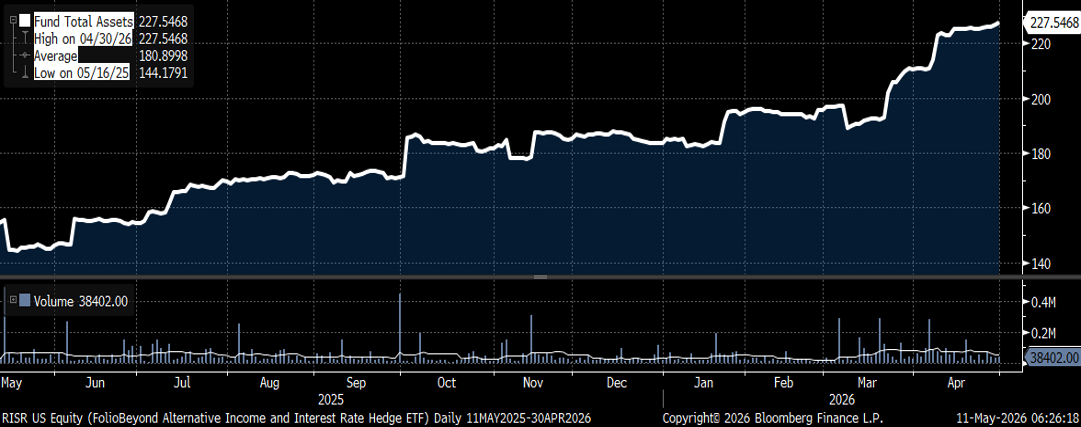
RISR saw capital inflows of around $17 million in April, a continuation of growth and assets under management, for which we are very grateful. The fund is rapidly approaching AUM thresholds required to gain access to some larger distribution platforms used by hundreds of thousands of RIAs. We have been actively engaged with these platforms to make sure we can launch quickly once the AUM minimums are achieved.
RISR – Total Fund Assets ($MM)
FIXP Performance Summary
FolioBeyond’s Enhanced Fixed Income Premium ETF (ticker: “FIXP”) seeks to provide income and, secondarily, long-term capital appreciation. The Fund invests in a portfolio of ETFs representing certain sectors of the fixed income market. In addition, the Fund seeks to generate additional income by writing options on these same ETFs, or other ETFs we believe have attractive prices and desirable correlation and volatility characteristics.
For the month of April, FIXP returned 2.09% (1.95% based on NAV). This was the single-largest monthly return since the fund’s inception. On a YTD basis, FIXP is now outperforming the Bloomberg U.S. Bond Market Aggregate Index by 168 bps. There were no reallocations during the month, aside from those caused by differential performance.
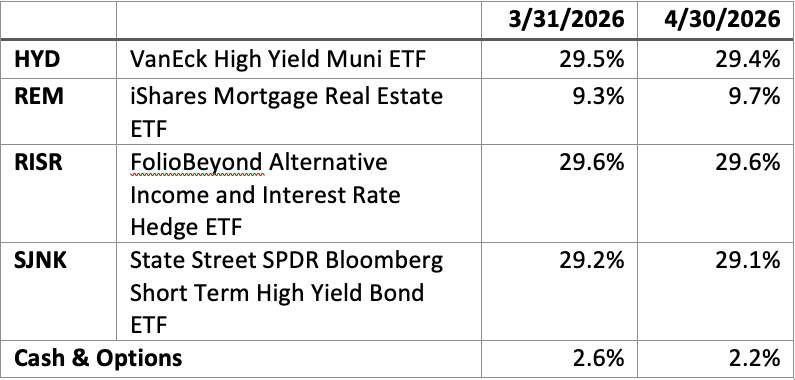
FIXP’s performance was driven principally by out-performance of REM, an ETF that holds mortgage REITS. REM showed price gain of 8.5% in April, more than offsetting the 5% drop in March. This outcome was driven by a growing “risk-on” attitude by investors broadly, and some specific good news for the ETF’s underlying holdings in NLY and AGNC. HYD, which holds high-yield municipal bonds also benefitted from the same appetite for yield, and was up over 2% on the month. The options overlay contributed an additional 10 bps of performance during the month.
The fund’s holding weights are produced by FolioBeyond’s dynamic reallocation model. Changes are made from a universe of 24 economically diverse fixed income ETFs, based on volatility, momentum, yield, default risk, and other factors and occur based on market observations rather than a fixed schedule.
The performance data quoted represents past performance. Past performance does not guarantee future results. The investment return and principal value of an investment will fluctuate so that an investor’s shares, when sold or redeemed, may be worth more or less than their original cost and current performance and may be lower or higher than the performance quoted. Performance current to the most recent month-end can be obtained by calling 866-497-4963. Short-term performance, in particular, is not a good indication of the fund’s future performance, and an investment should not be made based solely on returns. Returns beyond 1 year are annualized.
A fund's NAV is the sum of all its assets less any liabilities, divided by the number of shares outstanding. The market price is the most recent price at which the fund was traded. The fund intends to pay out income, if any, monthly. There is no guarantee that these distributions will be made.
Total Expense Ratio is 1.03%.
For FIXP standardized performance and fund holdings click here.
The allocation model that FIXP uses has been running for private clients and model portfolios for more than three years, and we are very excited to be bringing this advanced algorithm to ETF investors. Please reach out to us to learn more and to obtain detailed information and fund documents.
Market Review and Outlook
One of the more remarkable features of the economy and financial markets since the US-Iran conflict began, is how seemingly unperturbed investors are. On a short-term basis markets do rise and fall in line with the news flow, but the underlying bull market remains fully intact. In large part this is due to investor optimism about AI and everything related to it. The thesis seems to be that, even though there may be difficulties in certain economic sectors, especially those closely connected to oil prices, the AI revolution transcends these concerns. We can see this clearly if we look at the broad equity market, with and without AI.
US Stock Market – Total Return With and Without AI
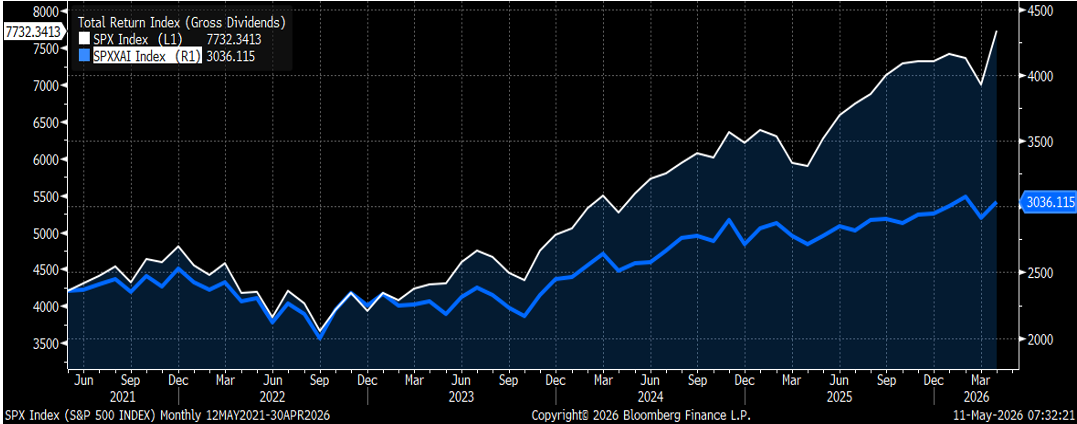
The chart plots the SPX (S&P 500) index total return, vs the SPXXAI index. The latter is an index produced by Goldman Sachs intended to remove the impacts on the SPX from AI connected companies. Notably, neither index includes several very large and important AI firms, including Anthropic and OpenAI, which do not have publicly traded shares.
As the graph shows, excluding AI related stocks produces a very different picture from the headline returns showing the market at all-time highs. Over the roughly last 5 years, SPX (left axis) has outperformed the SPXXAI (right axis) by 3.5x, 80% vs 28%. Going back to 2000, the difference is even sharper: SPX is up 718% vs SPXXAI up 210%. But for AI, sentiment around markets and the broader economy would be very different. Since the late February start of the Iran conflict, SPX is up 5%, while SPXXAI is actually down slightly.
One important consequence from this outperformance is that AI-related stocks are becoming an ever-increasing share of total public company valuations. Depending on which companies are included, by some estimates AI no accounts for around 35% of total stock market capitalization. This far exceeds the next three largest sectors of the market: Financials make up around 13%, and Communications, Consumer Discretionary and Healthcare each make up around 10%.
The upshot from all this is that the economy and financial markets are far less robust than implied by broad market indices. As we have noted in prior communications, labor markets are modestly softening. And even here concentration is a risk. Nearly all of the net hiring in the US has been healthcare related. For all other sectors combined, there has actually been a small net decline in jobs over the last several years.
Meanwhile, inflationary pressures continue to mount. We discussed above the direct impacts of higher oil prices on consumer spending. But there is growing evidence that household budgets are under real stress. Credit card balances and delinquencies are growing. While the Supreme Court struck down the broad IEEPA tariffs in February, the Trump Administration quickly responded by imposing new tariffs under other legal provisions. It remains to be seen how courts will rule on those, but for now, tariffs remain in place for many countries and many products.
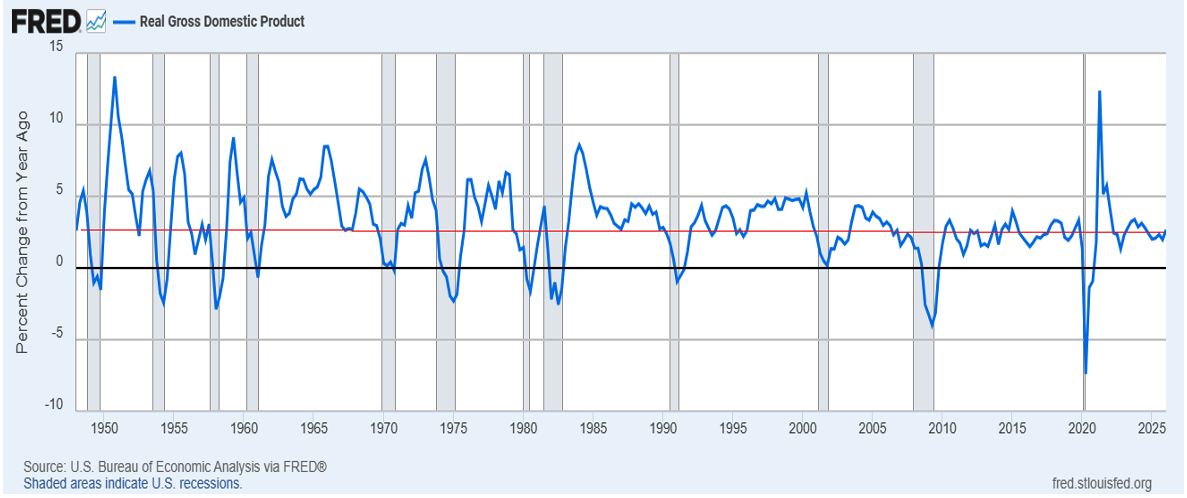
GDP growth remains positive, but is substantially weaker than the US economy has produced in prior periods. The chart below takes a long-term view of year-over-year growth in real GDP going back to the 1950s. The thin red line is set at 2.7% which is the latest reading. As can be readily seen, there have been many periods of much fast economic expansion, including during 1990s and early 2000s. So, covid aside, outright declines have been avoided since the great financial crisis, but the actual pace of growth is not particularly exciting. Financial assets, and real estate have continued their historic rises, but for the millions of households who own neither stocks nor real property the economy has been essentially flat for quite some time.
To summarize the current environment, we face:
· Increasing inflationary pressures that the Federal Reserve seems unable or unwilling to address.
· Sluggish albeit positive real economic growth.
· A massive and growing fiscal deficit that has seen debt-GDP soar from under 60% to more than 120% in less than a generation.
· A weakening jobs market.
· Two major military conflicts that threaten supplies of oil and other important by-products
· An extremely exuberant investor class, especially for all things AI, that is said to be “looking through” all of these challenges.
We believe this fact-set demands a focus on risk management and income generation. We have an investment eco-system with little institutional memory of how quickly things can turn, raised on a steady diet to “buy the dip.” We are not suggesting the “end is nigh,” or that investors should sell everything and go to cash. But we strongly encourage investors to look carefully at their portfolios for areas of risk and concentration.
Call it greed, or FOMO, or whatever term you prefer. But there is a widely held attitude of disregard for risk. It is often said, the market will do whatever causes the most damage to the most people. Being a bit of a contrarian can have benefits in volatile times.
Summary
Geopolitical risk is going to be with us for the foreseeable future. The Iranian conflict does not have an obvious fast off-ramp. Russia-Ukraine continues to drag on tragically. NATO seems to be fraying badly. AI has zero capacity to address these types of problems. There is a well-established playbook for this type of environment. Protect your capital and look for investments that generate current cash income. Trying to trade the news or time the markets in such an environment is reckless in the extreme. The news will always be faster and more unpredictable that you are as an investor.
Please contact us to explore how RISR and FIXP might fit into your overall strategy, to help you manage risk while generating an attractive current yield.
Performance
Portfolio Applications
We believe RISR and FIXP can provide attractive, thematic strategies that provide strong correlation benefits for both fixed income and equity portfolios. They can be utilized as part of a core holdings for diversified portfolios or as an overlay to manage the risks of fixed income portfolios. RISR can be used as a macro hedge against rising interest rates with less exposure to equity beta and negative correlation to fixed income beta. The underlying bonds are all U.S. agency credit that are guaranteed by FNMA, FHLMC or GNMA. Also, timing is on our side as the strategy generates current income if interest rates were to remain within a trading range. FIXP offers a broadly diversified exposure to multiple sectors of the fixed income markets in an algorithmically optimized manner.
Please contact us to explore how RISR and FIXP can be utilized as a unique tool to adjust your portfolio allocations in the current high volatility environment.
| Yung Lim | Dean Smith | George Lucaci |
|---|---|---|
| Chief Executive Officer | Chief Strategist and Marketing Officer | Global Head of Distribution |
| Chief Investment Officer | RISR Portfolio Manager | |
| ylim@foliobeyond.com | dsmith@foliobeyond.com | glucaci@foliobeyond.com |
| 917-892-9075 | 914-523-2180 | 908-723-3372 |
This material must be preceded or accompanied by a prospectus. For a copy of the prospectus please click here for RISR and here for FIXP.
Investments involve risk. Principal loss is possible. Unlike mutual funds, ETFs trade at a premium or discount to their net asset value. The fund is new and has limited operating history to judge fund risks. The value of MBS IOs is more volatile than other types of mortgage related securities. They are very sensitive not only to declining interest rates, but also to the rate of prepayments. MBS IOs involve the risk that borrowers default on their mortgage obligations or the guarantees underlying the mortgage-backed securities will default or otherwise fail and that, during periods of falling interest rates, mortgage-backed securities will be called or prepaid, which result in the Fund having to reinvest proceeds in other investments at a lower interest rate.
The Fund’s derivative investments have risks, including the imperfect correlation between the value of such instruments and the underlying assets or index; the loss of principal, including the potential loss of amounts greater than the initial amount invested in the derivative instrument. The value of the Fund’s investments in fixed income securities (not including MBS IOs) will fluctuate with changes in interest rates. Typically, a rise in interest rates causes a decline in the value of fixed income securities owned indirectly by the Fund. Please see the prospectus for a complete description of principal risks.
FIXP Risks
Underlying ETFs Risks. The Fund will incur higher and duplicative expenses because it invests in underlying ETFs, including Bond Sector ETFs and broad-based bond ETFs (collectively, “Underlying ETFs”). There is also the risk that the Fund may suffer losses due to the investment practices of the Underlying ETFs. The Fund will be subject to substantially the same risks as those associated with the direct ownership of securities held by the Underlying ETFs.
Fixed Income Risk. The prices of fixed income securities respond to economic developments, particularly interest rate changes, as well as to changes in an issuer's credit rating or market perceptions about the creditworthiness of an issuer. In general, the market price of fixed income securities with longer maturities will increase or decrease more in response to changes in interest rates than shorter-term securities.
Option Overlay Risk. The Fund's use of options involves various risks, including the risk that the options strategy may not provide the desired increase in income or may result in losses. Selling call and put options exposes the Fund to potentially significant losses if market movements are unfavorable. The Fund may also experience additional volatility and risk due to changes in implied volatility (the market's forecast of future volatility), strike prices, and market conditions. The Fund may sell options on instruments other than the Fund's Bond Sector ETFs. This can expose the Fund to the risk that options can vary in price in ways that do not correspond to the Bond Sector ETFs held by the Fund, so called basis-risk.
Interest Rate Risk. Generally, the value of fixed income securities will change inversely with changes in interest rates. As interest rates rise, the market value of fixed income securities tends to decrease. Conversely, as interest rates fall, the market value of fixed income securities tends to increase.
New Fund Risk. The Fund is a recently organized management investment company with no operating history. As a result, prospective investors do not have a track record or history on which to base their investment decisions.
Diversification does not eliminate the risk of experiencing investment losses.
Index Definitions
Bloomberg Barclays US Aggregate Bond Index: A broad-based benchmark that measures the investment grade, US dollar-denominated, fixed-rate taxable bond market. The index includes Treasuries, government-related and corporate securities, MBS (agency fixed-rate and hybrid ARM pass-throughs), ABS and CMBS (agency and non-agency).
US Treasury 7-10 Yr Bond Inversed Index: ICE U.S. Treasury 7-10 Year Bond 1X Inverse Index is designed to provide the inverse of the daily return of the ICE U.S. Treasury 7-10 Year Bond Index (IDCOT7). ICE U.S. Treasury 7-10 Year Bond Index tracks the performance of US dollar denominated sovereign debt publicly issued by the US government in its domestic market. Qualifying securities of the underlying index must have greater than or equal to seven years and less than 10 years remaining term to final maturity as of the rebalancing date, a fixed coupon schedule and an adjusted amount outstanding of at least $300 million.
S&P 500 Index: The S&P 500 Index, or Standard & Poor's 500 Index, is a market-capitalization-weighted index of 500 leading publicly traded companies in the U.S.
IBOXHY Index: iBoxx USD Liquid High Yield Total Return Index measures the USD denominated, sub-investment grade, corporate bond market. The index includes bonds with minimum 1 years to maturity,
minimum amount outstanding of USD 400 mil. Bond type includes fixed-coupon, step-up, bonds with
sinking funds, medium term notes, callable and putable bonds.
Definitions
Alpha: a return achieved above and beyond the return of a benchmark or proxy with a similar risk level.
Annualized Equivalent Yield: represents the annualized yield based on the most recent month of income distribution: (income distribution x 12 months)/price per share.
Basis Points (bps): Is a unit of measure used in quoting yields, changes in yields or differences between yields. One basis point is equal to 0.01%, or one one-hundredth of a percent of yield and 100 basis points equals 1%.
Beta measures: the volatility of a security or portfolio relative to an index. Less than one means lower volatility than the index; more than one means greater volatility.
Convexity: A measure of how the duration of a bond changes in correlation to an interest rate change. The greater the convexity of a bond the greater the exposure of interest rate risk to the portfolio.
Correlation: a statistic that measures the degree to which two securities move in relation to each other.
Coupon: is the annual interest rate paid on a bond, expressed as a percentage of the bond’s face value.
CUSIP: An identifier number that stands for the Committee on Uniform Securities Identification Procedures assigned to stocks and registered bonds in the United States and Canada.
Duration: measures a bond price’s sensitivity to changes in interest rates. The longer a bond’s duration, the higher its sensitivity to changes in interest rates and vice versa.
GNMA: Government National Mortgage Association
FNMA: Federal National Mortgage Association
FHLMC: Federal Home Loan Mortgage Corporation
Short Investment (Shorting): is a position that has been sold with the expectation that it will decrease in value, the intention being to repurchase it later at a lower price.
Distributed by Foreside Fund Services, LLC.