RISR & FIXP Commentary for January 2026
Click here for a pdf version of this commentary.
RISR Performance Summary
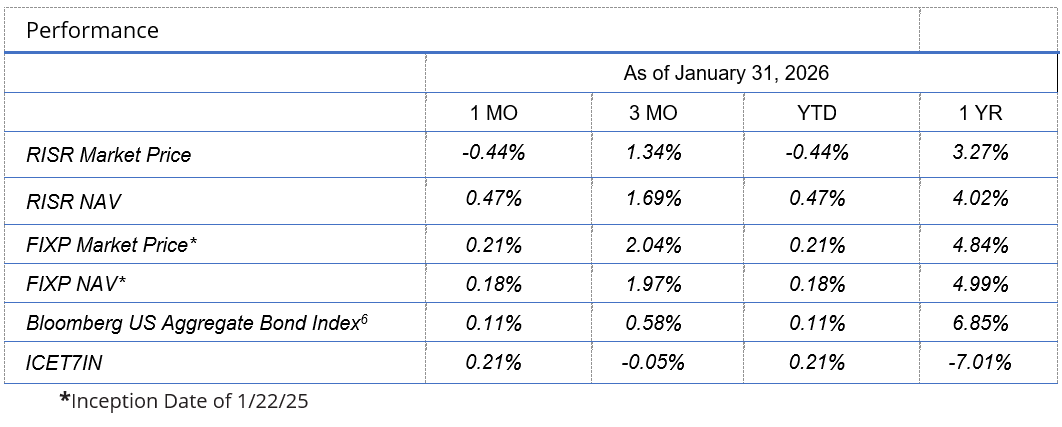
The FolioBeyond Alternative Income and Interest Rate Hedge ETF (ticker: RISR) returned -0.44% based on the closing market price (0.47% based on net asset value or “NAV”) in January. In comparison, the ICET7IN Index (US Treasury 7-Year Bond Inverse Index) returned 0.21% while the Bloomberg Barclays U.S. Aggregate Bond Index ("AGG") returned 0.11% during the same period.
The performance data quoted represents past performance. Past performance does not guarantee future results. The investment return and principal value of an investment will fluctuate so that an investor’s shares, when sold or redeemed, January be worth more or less than their original cost and current performance January be lower or higher than the performance quoted. Performance current to the most recent month-end can be obtained by calling 866-497-4963. Short-term performance, in particular, is not a good indication of the fund’s future performance, and an investment should not be made based solely on returns. Returns beyond 1 year are annualized.
A fund's NAV is the sum of all its assets less any liabilities, divided by the number of shares outstanding. The market price is the most recent price at which the fund was traded. The fund intends to pay out income, if any, monthly. There is no guarantee that these distributions will be made.
Total Expense Ratio is 1.04%.
For standardized performance click here.
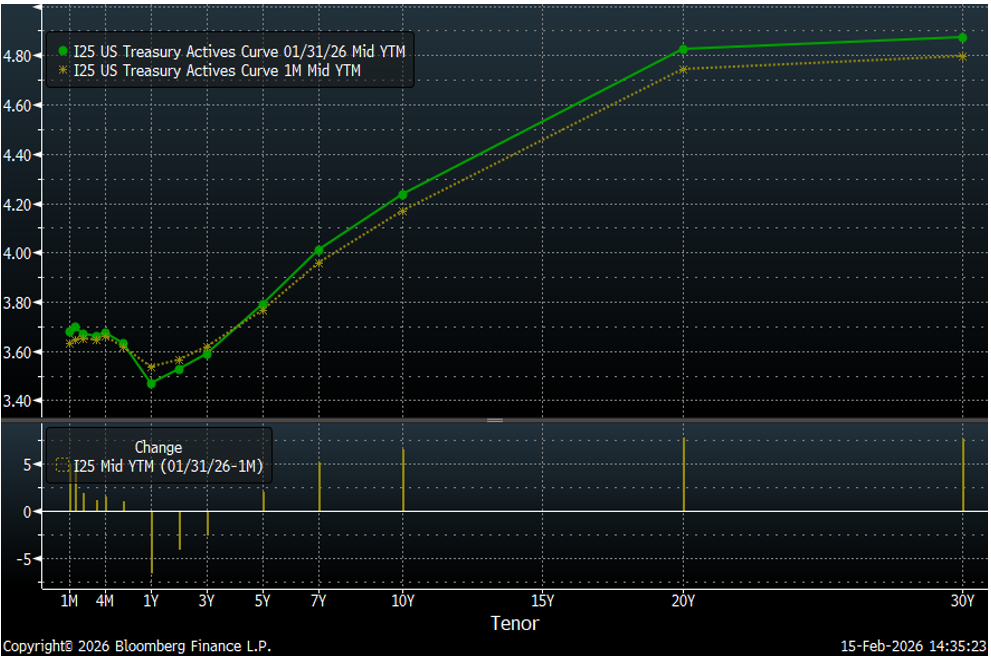
RISR produced a small negative return in January despite an increase in net asset value (NAV). This meant the price ended at a discount to NAV of around 0.35%. Interest rates were little changed over the month, as markets correctly predicted the Fed would hold the Fed Funds rate steady following a cumulative 175 bps in rate cuts from September 2024 through December 2025. Fed Chair Powell in his post meeting press conference repeated several times that the balance of risks between inflation and employment were more or less equal, so no additional policy adjustment was needed. This marked a distinct change in tone from earlier statements that labor markets were softening even as inflation held above the Fed’s 2% target. The actual job numbers released during the month were mixed, but the Fed chose to focus on how “the unemployment rate has shown some signs of stabilization.” It seems that the main indicator driving the decision was robust GDP growth that showed 4.4% annualized growth in Q4 2025.
There were two dissenting votes out of the 12 committee members, including, predictably Miran and Waller. Miran is a bit of a MAGA gadfly, and Waller has been lobbying for President Trump to nominate him for the next Fed Chair. However, Waller’s hopes were dashed two days later when Trump announced that former Fed Governor Kevin Warsh would get the nomination. This ended one of the longest periods of speculation in recent memory, and markets initially took Warsh to be a hawkish voice, based on his prior statements. But that view was short lived, and within a few days discussion turned to what Warsh must have promised Trump to get the nod.
While the Fed signaled no further near-term rate cuts were being absorbed by the markets, focus turned to the continued steepening of the yield curve, and its impact on housing and the financing of the Federal debt. The numbers are irrefutable and sobering. The US fiscal deficit is expanding at an unsustainable pace. And the Treasury’s borrowing needs are going to cause buyers of long term bonds to continue to demand additional compensation against the risk of re-accelerating inflation. At the same time the tariffs and other policy shifts from the administration are causing some foreign investors, including central banks to look for alternatives, even if on the margins.
Because of this, mortgage rates are holding above 6% as they have been since September 2022. mortgage prepayment speeds remain suppressed, as homeowners with very low interest rate mortgages obtained in the period immediately following Covid, are “trapped” in that they would face materially higher payments if they were to sell and buy a new home, even if the value of that home was close to or the same as their current residence. The White and others have proposed a number of quick-fix gimmicks to address this. But all of the proposals floated so far are either impractical, illegal or both.
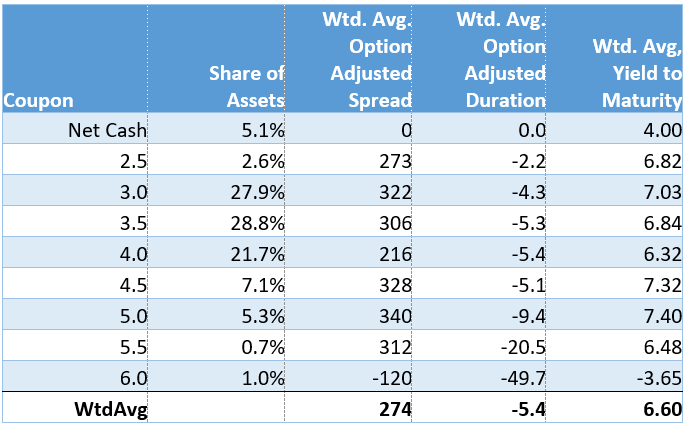
As we have noted in prior commentaries, RISR’s portfolio consists principally of mortgage loans with interest rates that are still far “out of the money” for refinance. Even if mortgage rates were to fall below 6%, it would only affect a very small percentage of our holdings.
Prepayment speeds for our holdings remain very low by historical standards. The table below shows the 3-month and 6-month prepayment rates [1] by underlying pool mortgage rate.
Prepayment Speeds for RISR IO Holdings
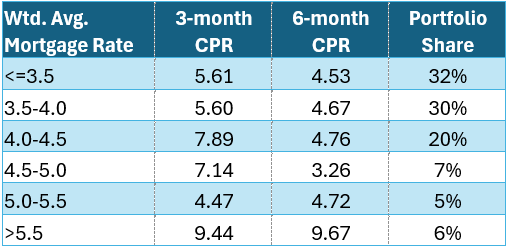
Most prepayment models consider CPRs in the range of 4-6% to be baseline housing turnover, i.e. due to life changes such as marriage, death, job transfer etc. So, despite a slight uptick in the 3-month over the 6-month average, the prepayment rates in the table above reflect minimal prepayment from interest rate incentives for the vast majority of RISR’s holdings. As recently as 2020-2021 CPRs of 20-40% were routinely observed even for mortgage rates as low as 3-4%. With current mortgage rates of 6%+, we expect prepayment speeds to remain suppressed for the foreseeable future.
RISR saw inflows of around $11.5 million in January, bringing total AUM to just shy of $200 million.
FIXP Performance Summary
FolioBeyond’s Enhanced Fixed Income Premium ETF (ticker: “FIXP”) seeks to provide income and, secondarily, long-term capital appreciation. The Fund invests in a portfolio of ETFs representing certain sectors of the fixed income market. In addition, the Fund seeks to generate additional income by writing options on these same ETFs, or other ETFs we believe have attractive prices and desirable correlation and volatility characteristics.
For the month of January, FIXP returned 0.21% (0.18% based on NAV). There were no reallocations during the month, aside from those caused by differential performance.
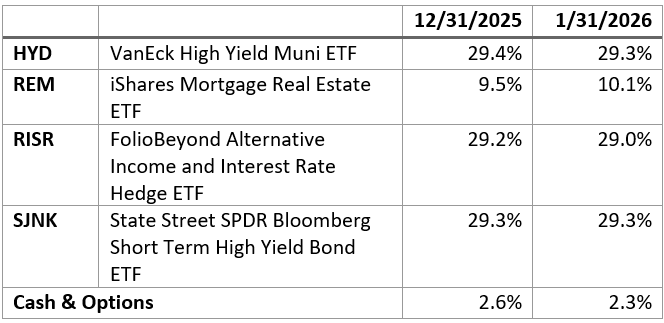
FIXP’s performance was driven principally by a strong outperformance of REM, which is an ETF that invests in mortgage REITs that returned 2.6% for the month.
The fund’s holding weights are produced by FolioBeyond’s dynamic reallocation model. Changes are made from a universe of 24 economically diverse fixed income ETFs, based on volatility, momentum, yield, default risk, and other factors and occur based on market observations rather than a fixed schedule. For the last handful of reallocations most of the changes have been between REM, BKLN and SJNK. This is not surprising given the volatile and shifting environment for real estate assets (REM), on the one hand, vs. high-yield corporates (SJNK) and bank loans, on the other.
The performance data quoted represents past performance. Past performance does not guarantee future results. The investment return and principal value of an investment will fluctuate so that an investor’s shares, when sold or redeemed, January be worth more or less than their original cost and current performance and January be lower or higher than the performance quoted. Performance current to the most recent month-end can be obtained by calling 866-497-4963. Short-term performance, in particular, is not a good indication of the fund’s future performance, and an investment should not be made based solely on returns. Returns beyond 1 year are annualized.
A fund's NAV is the sum of all its assets less any liabilities, divided by the number of shares outstanding. The market price is the most recent price at which the fund was traded. The fund intends to pay out income, if any, monthly. There is no guarantee that these distributions will be made.
Total Expense Ratio is 1.01%.
For FIXP standardized performance and fund holdings click here.
The allocation model that FIXP uses has been running for private clients and model portfolios for more than four years, and we are very excited to be bringing this advanced algorithm to ETF investors. Please reach out to us to learn more and to obtain detailed information and fund documents.
Market Review and Outlook
With President Trump’s nomination of Kevin Warsh, the question of who will replace Powell as Fed Chair is presumably settled. But there are still other big questions hovering over the market. First, who is Warsh and what are his beliefs about the role of the Fed? Second, with all the noise in the jobs numbers, how can policy makers know where the labor market actually stands? Third, how will the Supreme Court rule on the IEEPA tariffs, and what happens if they are struck down? Finally, what will be the impacts of the AI technology revolution in the near-term, and the medium-term?
Incoming Federal Reserve Chair Kevin Warsh
Kevin Warsh is a highly respected economic thinker and policy maker, who previously served as a Fed Governor from 2006-2011. He was reportedly instrumental in guiding Fed policy through Great Financial Crisis of 2008. In his public statements he has been broadly critical of recent Fed policy, especially regarding the massive increase in the Fed’s balance sheet since 2020. This increase has been blamed by many as a key driver of inflation over the last five years, which has led some to characterize Warsh as hawkish. But it is hard to square this characterization with the President’s abundantly clear preference for a more accommodative Fed policy. Trump has said repeatedly he believes interest rates should be materially lower and had sparred aggressively and publicly with Powell on this very question. Indeed, Powell now is under criminal investigation by the DOJ. Complicating matters is that NC Senator Tillis has stated Warsh’s nomination will not be taken up as long as Powell remains under investigation.
Inevitably this standoff will be resolved politically and Warsh’s nomination will move forward at some point, and he will almost surely be approved by the full Senate. What happens then? Warsh would hardly be the first Fed Chair to moderate his prior views once in the seat. Moreover, Warsh’s hawkish credentials can be called into question. If we look more closely at his criticism of current Fed policy, it is less about the Fed Funds rate and more about the role of the Fed in the economy writ large. He has stated that the Fed is too big, too activist, and needs to return to an older, more constrained business model. Ironically, he has also argued that the current Fed has been too slow (one of Trump’s favorite jabs) both in raising and cutting rates in response to economic performance.
It is also worth noting that the Fed Chair is but one of 12 votes on the FOMC, which sets the Fed Funds rate. Also, four of the current FOMC members will rotate out, and four new governors will take their places. Not a lot is known publicly about how the new group compares to the old. It is also unknown whether Powell stays on as a governor once his term as Chair ends in May.
On balance, it seems the 2026 Fed will be slightly more accommodative than the 2024-25 Fed which cut rates by 175 bps. The risk-on/risk-off pendulum swings with each new economic release. But a resumption of short-term rate cuts, combined with a plan to reduce the size of the Fed’s balance sheet by selling longer maturity Treasury and MBS holdings, suggests a further steepening of the yield curve, especially if inflation continues to track above the Fed’s 2% target.
Labor Market – “Lies, Damn Lies and Statistics”
Over the last handful of years, the data collection and dissemination regime at the Bureau of Labor Statistics has come under sharp criticism for inaccuracies and massive data revisions. This has been especially true with respect to jobs numbers. Some have suggested that BLS is manipulating the data to favor one side or the other for political purposes. This is almost surely untrue. Instead, the BLS has been starved for resources, and big demographic and macro-economic changes have caused them to fall short of the high accuracy one might expect from the developed world’s premier government statistical data collection agency.
Whatever the reason, BLS has been forced to issue massive revisions in recent years. In 2025, new jobs were revised downward by more than one million, and by a total of more than two million from 2023-2025. These and other sources indicate the US economy has seen very meager job growth in recent years. At the same time, the unemployment rate has barely increased and now stands at a reasonably strong 4.3%.
These revisions have left policy makers unclear about the strength of the labor market. Another complicating factor is the loss of up to 2 million undocumented workers who have left the country and the workforce under the new, more restrictive immigration policies. By definition undocumented workers are harder to count, so a great deal of uncertainty has been introduced, especially in sectors such as agriculture, construction and hospitality. Regardless of one’s political views, such workers are an important part of the labor market and the economy, and they are counted the same as any other worker in the country. Their self-removal from the workforce has caused significant measurement issues for the BLS.
Traditionally the Fed has focused on the unemployment rate as the primary indicator of its success in meeting its statutory mandate to seek “full employment.” But only those not working while actively seeking employment are counted as unemployed. This excludes discouraged workers, and those working off the books, so the unemployment rate is hardly a perfect indicator under ideal reporting conditions. However, the massive downward revisions and general noisy-ness of the new jobs numbers cannot be ignored. Nor can the fact that many of the job losses have come in the government sector, which is not amenable to rate cuts as a stimulant to hiring.
All of this greatly complicates the Fed’s job, and there is no easy or quick fix. Absent clear and compelling evidence of deterioration, the prudent course would be to wait for confirmation before executing fiscal or monetary policy measures to stimulate hiring. Doing so preemptively risks pushing inflation higher. That has been the stance of the current Fed leadership. It remains to be seen if that changes going forward.
Tariffs at the Supreme Court
Markets have been anxiously awaiting a ruling from the Supreme Court on the legality of the tariffs imposed in 2025 under the claimed authority from the International Emergency Economic Powers Act of 1977 (IEEPA). A ruling could come at any time, with expectations high for this month. The court will rule on the tariffs, and if those are struck down, on what to do with the billions in tariffs already collected. Even if they lose, the administration claims to have ample alternative authorities it can use to craft more specific tariffs, and it is certain they have worked out plans to do so if required.
There is a growing acknowledgment that the tariffs are contributing meaningfully to inflationary pressures, so removing those would seem to have a moderating effect. But if the response to an unfavorable ruling is to re-impose a similar level of tariffs under alternative statutes, then that effect could be mooted. The only thing that can be said with certainty is that President Trump has been a proponent of tariffs for his entire political career, and will not be deterred by one adverse court ruling, unless it is extraordinarily broad. Tariffs are at the core of his geopolitical creed, if he can be said to have one. Markets and policy makers should be prepared to deal with tariffs at least until 2028, and likely much longer.
AI’s Economic Impact
Since the start of 2026, there has been a sea change in thinking about how AI will impact the economy and society. The so-called Magnificent Seven tech stocks led the stock market to record highs over the last couple of years, and are now leading it lower as investors come to re-evaluate how AI will affect businesses and jobs. There have been seemingly outlandish claims from Elon Musk and others that AI will essentially replace human labor in the next decade or even sooner. If even a mild version of that were to occur, the societal and economic impact would be profound. The euphoria about AI-led efficiency has soured into something like doomerism about the future where AI powered agents perform most tasks with greater skill and efficiency than humans. This obviously includes tech sector workers, but also jobs across a range of skill and training levels from truck drivers to lawyers, and even to investment managers!
Our view is both the prior euphoria and current despondency are overdone. AI is clearly a generational development that will have wide-ranging effects, both good and bad. But a lot of the hype is just that. Just as mechanization led to mass labor migration from the farms to urban factories, AI will lead to changes in the workforce composition. In the near term, one should not get too caught up in the extreme predictions in either direction. 2026 is likely to be a shake-out year where technological developments get scrutinized more closely, especially with respect to such things as privacy, and protection of intellectual property. There will have to be regulation of some kind. But with international cooperation at a low ebb right now, getting the tech titans in the US, China and to a lesser extent the EU to agree on anything will be extremely challenging. For now, expect more market volatility around developments and innovations coming from these highly impactful systems.
Summary
There is a prudent, well-established playbook for this type of environment. Protect your capital and look for investments that generate current cash income. Trying to trade the news or time the markets in such an environment is reckless in the extreme. The news will always be faster and more unpredictable that you are as an investor.
Please contact us to explore how RISR and FIXP might fit into your overall strategy, to help you manage risk while generating an attractive current yield. Best of luck to our investors in 2026!
[1] CPR = Conditional Prepayment Rate, which is the annualized rate of prepayments expressed as a percentage of the prior month ending balance.
Portfolio Applications
We believe RISR and FIXP can provide attractive, thematic strategies that provide strong correlation benefits for both fixed income and equity portfolios. They can be utilized as part of a core holdings for diversified portfolios or as an overlay to manage the risks of fixed income portfolios. RISR can be used as a macro hedge against rising interest rates with less exposure to equity beta and negative correlation to fixed income beta. The underlying bonds are all U.S. agency credit that are guaranteed by FNMA, FHLMC or GNMA. Also, timing is on our side as the strategy generates current income if interest rates were to remain within a trading range. FIXP offers a broadly diversified exposure to multiple sectors of the fixed income markets in an algorithmically optimized manner.
Please contact us to explore how RISR and FIXP can be utilized as a unique tool to adjust your portfolio allocations in the current high volatility environment.
| Yung Lim | Dean Smith | George Lucaci |
|---|---|---|
| Chief Executive Officer | Chief Strategist and Marketing Officer | Global Head of Distribution |
| Chief Investment Officer | RISR Portfolio Manager | |
| ylim@foliobeyond.com | dsmith@foliobeyond.com | glucaci@foliobeyond.com |
| 917-892-9075 | 914-523-2180 | 908-723-3372 |
This material must be preceded or accompanied by a prospectus. For a copy of the prospectus please click here for RISR and here for FIXP.
Investments involve risk. Principal loss is possible. Unlike mutual funds, ETFs trade at a premium or discount to their net asset value. The fund is new and has limited operating history to judge fund risks. The value of MBS IOs is more volatile than other types of mortgage related securities. They are very sensitive not only to declining interest rates, but also to the rate of prepayments. MBS IOs involve the risk that borrowers default on their mortgage obligations or the guarantees underlying the mortgage-backed securities will default or otherwise fail and that, during periods of falling interest rates, mortgage-backed securities will be called or prepaid, which result in the Fund having to reinvest proceeds in other investments at a lower interest rate.
The Fund’s derivative investments have risks, including the imperfect correlation between the value of such instruments and the underlying assets or index; the loss of principal, including the potential loss of amounts greater than the initial amount invested in the derivative instrument. The value of the Fund’s investments in fixed income securities (not including MBS IOs) will fluctuate with changes in interest rates. Typically, a rise in interest rates causes a decline in the value of fixed income securities owned indirectly by the Fund. Please see the prospectus for a complete description of principal risks.
FIXP Risks
Underlying ETFs Risks. The Fund will incur higher and duplicative expenses because it invests in underlying ETFs, including Bond Sector ETFs and broad-based bond ETFs (collectively, “Underlying ETFs”). There is also the risk that the Fund may suffer losses due to the investment practices of the Underlying ETFs. The Fund will be subject to substantially the same risks as those associated with the direct ownership of securities held by the Underlying ETFs.
Fixed Income Risk. The prices of fixed income securities respond to economic developments, particularly interest rate changes, as well as to changes in an issuer's credit rating or market perceptions about the creditworthiness of an issuer. In general, the market price of fixed income securities with longer maturities will increase or decrease more in response to changes in interest rates than shorter-term securities.
Option Overlay Risk. The Fund's use of options involves various risks, including the risk that the options strategy may not provide the desired increase in income or may result in losses. Selling call and put options exposes the Fund to potentially significant losses if market movements are unfavorable. The Fund may also experience additional volatility and risk due to changes in implied volatility (the market's forecast of future volatility), strike prices, and market conditions. The Fund may sell options on instruments other than the Fund's Bond Sector ETFs. This can expose the Fund to the risk that options can vary in price in ways that do not correspond to the Bond Sector ETFs held by the Fund, so called basis-risk.
Interest Rate Risk. Generally, the value of fixed income securities will change inversely with changes in interest rates. As interest rates rise, the market value of fixed income securities tends to decrease. Conversely, as interest rates fall, the market value of fixed income securities tends to increase.
New Fund Risk. The Fund is a recently organized management investment company with no operating history. As a result, prospective investors do not have a track record or history on which to base their investment decisions.
Diversification does not eliminate the risk of experiencing investment losses.
Index Definitions
Bloomberg Barclays US Aggregate Bond Index: A broad-based benchmark that measures the investment grade, US dollar-denominated, fixed-rate taxable bond market. The index includes Treasuries, government-related and corporate securities, MBS (agency fixed-rate and hybrid ARM pass-throughs), ABS and CMBS (agency and non-agency).
US Treasury 7-10 Yr Bond Inversed Index: ICE U.S. Treasury 7-10 Year Bond 1X Inverse Index is designed to provide the inverse of the daily return of the ICE U.S. Treasury 7-10 Year Bond Index (IDCOT7). ICE U.S. Treasury 7-10 Year Bond Index tracks the performance of US dollar denominated sovereign debt publicly issued by the US government in its domestic market. Qualifying securities of the underlying index must have greater than or equal to seven years and less than 10 years remaining term to final maturity as of the rebalancing date, a fixed coupon schedule and an adjusted amount outstanding of at least $300 million.
S&P 500 Index: The S&P 500 Index, or Standard & Poor's 500 Index, is a market-capitalization-weighted index of 500 leading publicly traded companies in the U.S.
IBOXHY Index: iBoxx USD Liquid High Yield Total Return Index measures the USD denominated, sub-investment grade, corporate bond market. The index includes bonds with minimum 1 years to maturity,
minimum amount outstanding of USD 400 mil. Bond type includes fixed-coupon, step-up, bonds with
sinking funds, medium term notes, callable and putable bonds.
Definitions
Alpha: a return achieved above and beyond the return of a benchmark or proxy with a similar risk level.
Annualized Equivalent Yield: represents the annualized yield based on the most recent month of income distribution: (income distribution x 12 months)/price per share.
Basis Points (bps): Is a unit of measure used in quoting yields, changes in yields or differences between yields. One basis point is equal to 0.01%, or one one-hundredth of a percent of yield and 100 basis points equals 1%.
Beta measures: the volatility of a security or portfolio relative to an index. Less than one means lower volatility than the index; more than one means greater volatility.
Convexity: A measure of how the duration of a bond changes in correlation to an interest rate change. The greater the convexity of a bond the greater the exposure of interest rate risk to the portfolio.
Correlation: a statistic that measures the degree to which two securities move in relation to each other.
Coupon: is the annual interest rate paid on a bond, expressed as a percentage of the bond’s face value.
CUSIP: An identifier number that stands for the Committee on Uniform Securities Identification Procedures assigned to stocks and registered bonds in the United States and Canada.
Duration: measures a bond price’s sensitivity to changes in interest rates. The longer a bond’s duration, the higher its sensitivity to changes in interest rates and vice versa.
GNMA: Government National Mortgage Association
FNMA: Federal National Mortgage Association
FHLMC: Federal Home Loan Mortgage Corporation
Short Investment (Shorting): is a position that has been sold with the expectation that it will decrease in value, the intention being to repurchase it later at a lower price.
Distributed by Foreside Fund Services, LLC.