
RISR & FIXP Commentary for September 2026
Click here for a pdf version of this commentary.
RISR Performance Summary
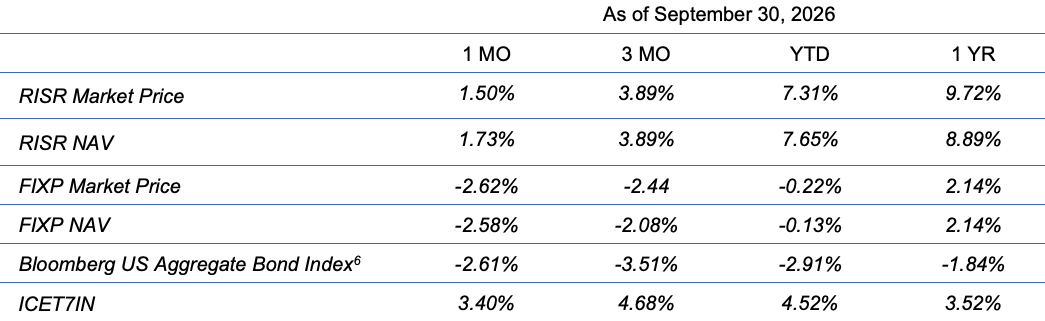
The FolioBeyond Alternative Income and Interest Rate Hedge ETF (ticker: RISR) returned 1.50% based on the closing market price (1.73% based on net asset value or “NAV”) in September. In comparison, the ICET7IN Index (US Treasury 7-Year Bond Inverse Index) returned 3.40% while the Bloomberg Barclays U.S. Aggregate Bond Index ("AGG") returned -2.61% during the same period. The monthly dividend paid was $0.18 per share on a closing share price of $37.06, which translates to a 5.83% annualized dividend yield.
The performance data quoted represents past performance. Past performance does not guarantee future results. The investment return and principal value of an investment will fluctuate so that an investor’s shares, when sold or redeemed, may be worth more or less than their original cost and current performance may be lower or higher than the performance quoted. Performance current to the most recent month-end can be obtained by calling 866-497-4963. Short-term performance, in particular, is not a good indication of the fund’s future performance, and an investment should not be made based solely on returns. Returns beyond 1 year are annualized.
A fund's NAV is the sum of all its assets less any liabilities, divided by the number of shares outstanding. The market price is the most recent price at which the fund was traded. The fund intends to pay out income, if any, monthly. There is no guarantee that these distributions will be made.
Total Expense Ratio is 1.04%.
For standardized performance click here.
The rising interest rate trend that began at the start of 2022 accelerated sharply in September. The yield on the 10-year Treasury bond rose from 4.75% to 5.29% over the course of the month. This 53.6 bps jump was the 5th largest in nearly five years. At month end, the 10-year yield was at its highest level since Q2 2007, just before the great financial crisis.
Naturally, this has got the attention of policy makers in Washington, as well as investors. President Trump has long made clear his desire for lower interest rates. Treasury Secretary Scott Bessent on September 8th declared “I am the house, now,” effectively daring market participants to take rates higher. That gambit clearly failed.
At its September meeting, the FOMC raised its target Federal Funds rate by 25bps, to 4%. This was widely expected, but it provided further evidence that the central bank views inflation as an ongoing threat, despite the preferences of the Trump Administration. They still have two more meetings in 2026, but most observers predict no additional hikes until after the November mid-term elections. This would be in keeping with historical precedent, as no Fed Chairman wants to be seen as explicitly helping or hurting either party.
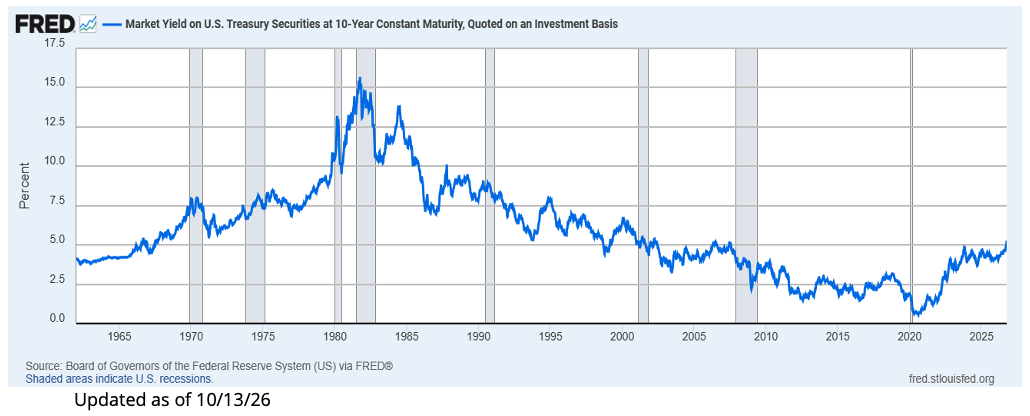
Mortgage rates rose even more dramatically, climbing by 75 bps, to end the month at nearly 7.50%.[1] This means the so-called “mortgage spread” (mortgage rate minus 10-year yield) widened by more than 20 bps. Not surprisingly, these shifts caused prepayment rates to drop materially during the month. Some cohorts saw declines of almost 10%. One news outlet reported that less than 5% of outstanding US fixed-rate mortgages could be economically refinanced under current market conditions. Mortgage prepayment rates, especially for lower coupons under, say, 5%, are approaching baseline housing turnover. This is the irreducible pace of prepayments due to death, divorce and other life events that are not economically based.
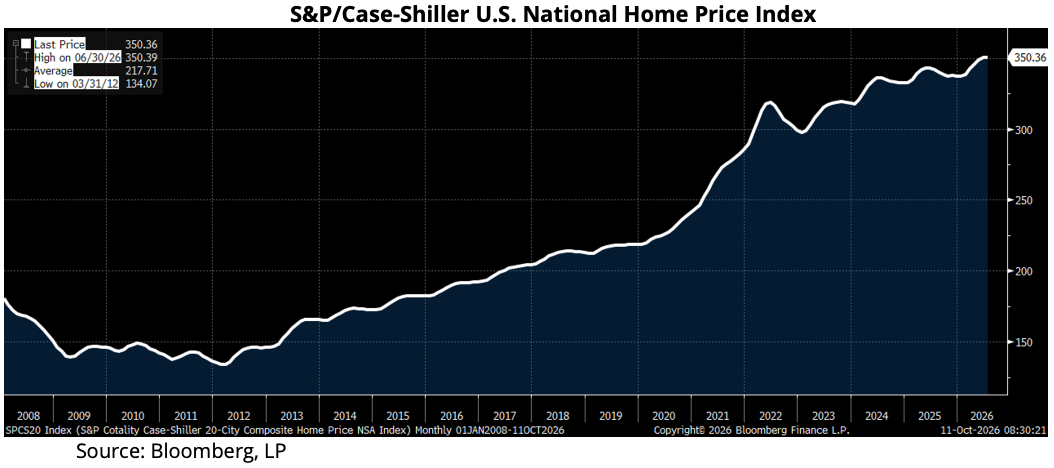
Despite these impacts, and contrary to many predictions, this has not caused a broad decline in home prices. In fact, the widely followed S&P/Case-Shiller index stands close to its all-time high. The US housing market is frozen, with many new homebuyers unable to qualify for high monthly payments, and existing homeowners with mortgages far below current rates, unable or unwilling to sell, since they, too, would likely face much higher monthly payments on a new home. Absent a meaningful decline in home prices and/or mortgage rates, we could be in this low transaction volume environment for the foreseeable future.
[1] National average for 30-year fixed rate mortgages as reported by bankrate.com.
Notwithstanding the human toll, this is an ideal environment for RISR. Our MBS IO investments, benefit from slowing prepayment rates, since the longer existing mortgages remain outstanding, the longer we receive the interest cashflows from those mortgage loans.
When the fund was launched in 2021, the predominant range of coupons on our investments was in the 3-4% range. As rates have climbed, those positions still hold value, and still produce attractive returns, but they do not have the same price responsiveness as they did when rates were much lower. For that reason, earlier this year we started buying IOs with much higher coupons, in the 5.5-6.5% range. These bonds have much greater interest rate sensitivity (i.e., negative duration) than bonds with lower coupons. Many of these securities were prepaying at speeds as high as 30 CPR[2], in the first part of the year. In the current rate environment, we are seeing a collapse in those speeds to the 10-15 CPR range. We fully expect those prepayment speeds to decline further, as Q4 and Q1 are historically the lowest periods for housing turnover, regardless of where mortgage rates stand.
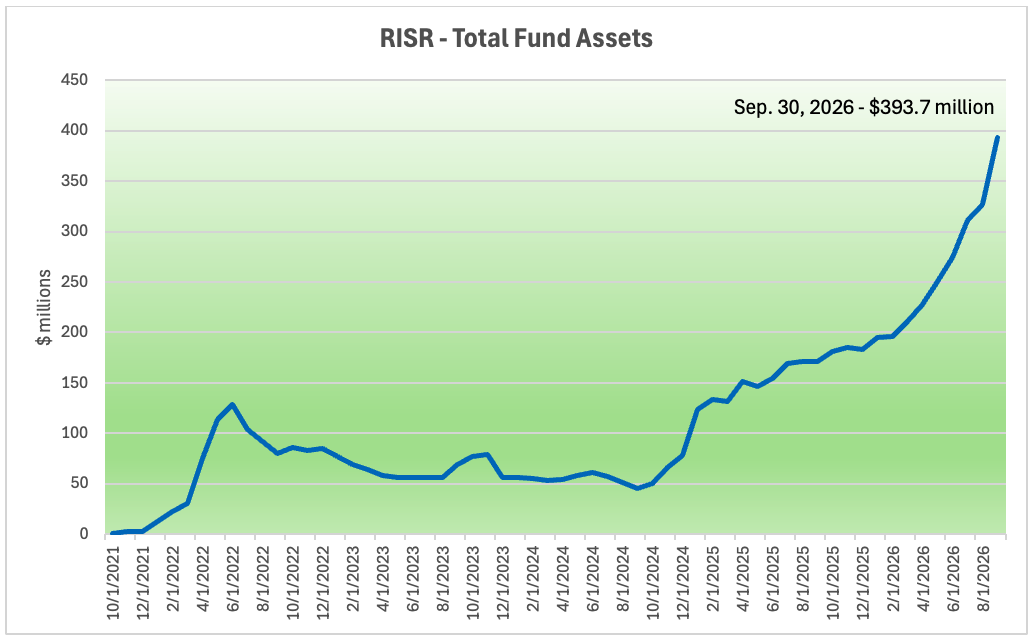
RISR saw very strong inflows during the month of September. Investors added more than $69 million during the month, which was the largest monthly increase since the fund’s inception. For Q3, we had inflows of more than $119 million. Along with increasing AUM, trading volumes have steadily increased. During the month more than 3 million shares traded, and the average bid-ask spread has been consistently below 0.50% since the end of Q1.
As we mentioned last month, getting RISR approved for advisors on the LLPL platform was an important achievement, and we hope to see additional growth from that channel.
[2] Conditional Prepayment Rate: The annualized rate of prepayment expressed as a percentage of the preceding month’s loan balance.
FIXP Performance Summary
FolioBeyond’s Enhanced Fixed Income Premium ETF (ticker: “FIXP”) seeks to provide income and, Secondarily, long-term capital appreciation. The Fund invests in a portfolio of ETFs representing a broad array of sectors of the fixed income market. In addition, the Fund seeks to generate additional income by writing options on these same ETFs, or other ETFs we believe have attractive prices and desirable correlation and volatility characteristics.
For the month of September, FIXP returned -2.62% (-2.58% based on NAV). The broad bond market Bloomberg Aggregate index was down a similar amount at -2.61%. While a negative monthly return is never desirable, it should be noted that FIXP is not intended to be market neutral. When the broad market declines as it did in September, FIXP’s return for that month can be negative. However, the fund’s actual goal—outperforming the broad bond market over time—remains intact. YTD, FIXP’s total return is -0.22% while the Bloomberg Aggregate index is down by 2.91% for the same time period. Equally important, FIXP’s outperformance is not based on a higher risk profile. FIXP’s 180-day volatility is 4.35%, which is less than the broad market volatility of 4.53%.
There were material portfolio reallocations during the month. The fund sold its positions in municipal credit (HYD) and long-term Treasury exposure (TLT), and allocated those funds to TIP, an inflation-protected treasury bond ETF, plus a small allocation to floating rate bank loans (BKLN). At month end, FIXP’s holdings were as follows. These changes were made early in the month and shortened the fund’s duration somewhat. But the rise in market yields and widening mortgages spreads caused a sharp decline in the price of REM, an ETF that holds mortgage REIT shares. REM has displayed a high degree of volatility historically, but that is partially offset by its 11+% dividend yield.
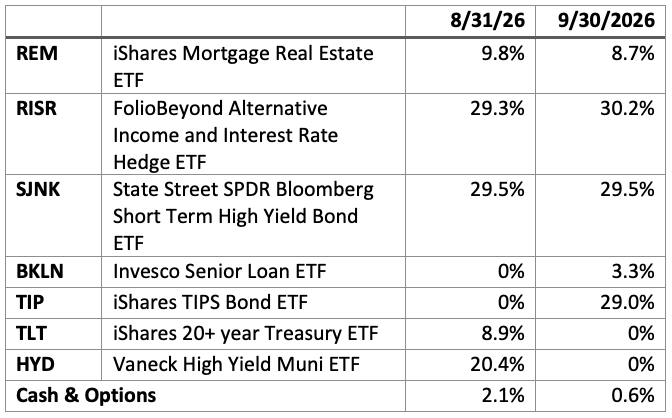
The fund’s holding weights are produced by FolioBeyond’s dynamic reallocation model. Changes are made from a universe of 24 economically diverse fixed income ETFs, based on volatility, momentum, yield, default risk, and other factors and occur based on market observations rather than a fixed schedule.
The performance data quoted represents past performance. Past performance does not guarantee future results. The investment return and principal value of an investment will fluctuate so that an investor’s shares, when sold or redeemed, may be worth more or less than their original cost and current performance and may be lower or higher than the performance quoted. Performance current to the most recent month-end can be obtained by calling 866-497-4963. Short-term performance, in particular, is not a good indication of the fund’s future performance, and an investment should not be made based solely on returns. Returns beyond 1 year are annualized.
A fund's NAV is the sum of all its assets less any liabilities, divided by the number of shares outstanding. The market price is the most recent price at which the fund was traded. The fund intends to pay out income, if any, monthly. There is no guarantee that these distributions will be made.
Total Expense Ratio is 1.03%.
For FIXP standardized performance and fund holdings click here.
The allocation model that FIXP uses has been running for private clients and model portfolios for more than three years, and we are very excited to be bringing this advanced algorithm to ETF investors. Please reach out to us to learn more and to obtain detailed information and fund documents.
Market Review and Outlook
As noted above, Treasury Secretary Bessent’s “I am the house now” claim, daring the markets to push rates higher, was taken by bond investors as a challenge rather than a threat. When he made the statement, the 10-year bond was yielding 4.79%. By month end it was at 5.29% and a few days later he was forced to conceded that “I can’t control the bond market.” You don’t say.
President Trump was likewise humbled by reality. After the Fed raised its Fed Funds target from 3.75% to 4.00% on September 19, the president said that he told his recently appointed Fed Chair Warsh, “You might as well vote with the board because it’s not going to matter.”
The plain reality is that interest rates are being driven higher by several forces that are outside the immediate control of the Administration or the Fed. Moreover, this is not a US-only phenomenon. Interest rates are rising as fast or faster than the US in many advanced western economies, including UK, Australia and most of the European Union. In no particular order, rates are rising due to: high energy prices related to the widening military conflicts in the Middle East; the seemingly endless war between Russia and Ukraine, which has now taken a direct focus on oil refining capacity; spiraling debt and deficits in numerous countries in addition to the US, which no political party seems to seriously be addressing; the breakdown of the “carry trade” due to rising interest rates in Japan; trillions of new borrowing demands from AI-related data center capital expenditures. All of these have combined to cause significant concerns about the ability of debt markets to absorb these simultaneous shocks.
Despite the recent rise, interest rates are not even particularly high, by historical standards. It is only when one compares current levels to the artificially repressed levels of the 2010s that makes it seem so. Taking a longer perspective, with the exception of a brief period after the collapse of the LTCM hedge fund, and Russian debt default, the 10-year yield was higher than today’s levels for the entire period from 1967 through 2001. Then in quick succession came the dot-com bubble collapse, the sub-prime financial crisis and, of course, covid. It seems likely that most reasonable investors would prefer rates at current levels rather than repeat those traumatic episodes, just to get rates a bit lower.
Near-term US Outlook
The US mid-term elections will be held in just a few weeks. Based on polling data, it is looking near certain that the Democrats will take back control of the House, and increasingly likely they may take the Senate, as well. President Trump’s approval ratings are in the low- to mid-30% range. Even solidly Republican states such as Texas are in play. What can markets expect if Congress comes under total Democrat control?
House Democrat leader, and presumed Speaker front-runner Hakeem Jeffries was recently asked about his plans if they do take control. His basic response was they would seek to restore the spending cuts enacted by the Trump Administration. In a word, then, they plan to increase spending even further. There is little reason to doubt his word on this.
In addition, there will likely be endless hearings, investigations and impeachment efforts. These will almost surely extend beyond the president himself to other cabinet officials and aides. Since the president still retains his veto, and the Senate is unlikely to have a majority large enough to over-ride those vetoes, this is clearly a recipe for gridlock for the remaining two years of Trump’s term.
In that case, federal spending will continue to spiral, more or less on autopilot, boosted by whatever program restorations the Democrats are able to jam through. This is not scenario that naturally leads to lower interest rates.
One potential offset is if the Democrats can somehow force a withdrawal by the US from Iran, which would reduce military spending in the near term. Some have called for that, but it is not a universal opinion. And it is not at all clear that a hasty or chaotic withdrawal would quickly lead to lower energy prices. For one thing, it would leave Iran in complete control over the Strait of Hormuz, and which countries’ vessels they permitted to transport oil through the waterway. Secondly, a tremendous amount of destruction has occurred to the refining capacity of the region. This is not only for Iran, but also for surrounding states. In addition, the conflict between the Houthis in Yemen and Saudia Arabia is heating up. Attacks on refining capacity as well as civilian targets have increased and the US has little, if any, ability to influence that situation, given shortages of materiel.
In sum, there is little on the horizon that would support a case for a near-term decline in interest rates. If the AI “bubble” were to burst, leading to a cancellation or sharp reduction of data-center construction, that would take pressure off rates. But with the importance of the AI boom to the economy and markets, one has to assume measures will be taken to avoid a total collapse of the growth trajectory. AI itself has become “too big to fail.”
Summary
The macro-economy has shown surprising resilience in 2026. Unemployment remains low, and GDP growth has been reasonably strong. Because inflation remains stubbornly above their 2% target, the Fed is effectively painted into a corner and will be forced to raise rates again, if not before the election, then likely soon after. Leaving aside potential cracks in the AI-led sectors, there is almost no indicator that is leading toward lower interest rates.
If you haven’t done so already, it is time to take seriously the risks to your clients’ investment portfolios.
There is a well-established playbook for this type of environment. Protect your capital and look for investments that generate current cash income. Trading headlines or social media posts is contrary to prudent risk management. Carefully evaluate your risk exposures and position yourself to not get caught offsides if conditions deteriorate further.
Please contact us to explore how RISR and FIXP might fit into your overall strategy, to help you manage risk while generating an attractive current yield.
[1] https://www.stlouisfed.org/on-the-economy/2026/jan/tracking-ai-contribution-gdp-growth
[2] https://www.nber.org/system/files/working_papers/w34836/w34836.pdf
Performance
Portfolio Applications
We believe RISR and FIXP can provide attractive, thematic strategies that provide strong correlation benefits for both fixed income and equity portfolios. They can be utilized as part of a core holdings for diversified portfolios or as an overlay to manage the risks of fixed income portfolios. RISR can be used as a macro hedge against rising interest rates with less exposure to equity beta and negative correlation to fixed income beta. The underlying bonds are all U.S. agency credit that are guaranteed by FNMA, FHLMC or GNMA. Also, timing is on our side as the strategy generates current income if interest rates were to remain within a trading range. FIXP offers a broadly diversified exposure to multiple sectors of the fixed income markets in an algorithmically optimized manner.
Please contact us to explore how RISR and FIXP can be utilized as a unique tool to adjust your portfolio allocations in the current high volatility environment.
| Yung Lim | Dean Smith | George Lucaci |
|---|---|---|
| Chief Executive Officer | Chief Strategist and Marketing Officer | Global Head of Distribution |
| Chief Investment Officer | RISR Portfolio Manager | |
| ylim@foliobeyond.com | dsmith@foliobeyond.com | glucaci@foliobeyond.com |
| 917-892-9075 | 914-523-2180 | 908-723-3372 |
This material must be preceded or accompanied by a prospectus. For a copy of the prospectus please click here for RISR and here for FIXP.
Investments involve risk. Principal loss is possible. Unlike mutual funds, ETFs trade at a premium or discount to their net asset value. The fund is new and has limited operating history to judge fund risks. The value of MBS IOs is more volatile than other types of mortgage related securities. They are very sensitive not only to declining interest rates, but also to the rate of prepayments. MBS IOs involve the risk that borrowers default on their mortgage obligations or the guarantees underlying the mortgage-backed securities will default or otherwise fail and that, during periods of falling interest rates, mortgage-backed securities will be called or prepaid, which result in the Fund having to reinvest proceeds in other investments at a lower interest rate.
The Fund’s derivative investments have risks, including the imperfect correlation between the value of such instruments and the underlying assets or index; the loss of principal, including the potential loss of amounts greater than the initial amount invested in the derivative instrument. The value of the Fund’s investments in fixed income securities (not including MBS IOs) will fluctuate with changes in interest rates. Typically, a rise in interest rates causes a decline in the value of fixed income securities owned indirectly by the Fund. Please see the prospectus for a complete description of principal risks.
FIXP Risks
Underlying ETFs Risks. The Fund will incur higher and duplicative expenses because it invests in underlying ETFs, including Bond Sector ETFs and broad-based bond ETFs (collectively, “Underlying ETFs”). There is also the risk that the Fund may suffer losses due to the investment practices of the Underlying ETFs. The Fund will be subject to substantially the same risks as those associated with the direct ownership of securities held by the Underlying ETFs.
Fixed Income Risk. The prices of fixed income securities respond to economic developments, particularly interest rate changes, as well as to changes in an issuer's credit rating or market perceptions about the creditworthiness of an issuer. In general, the market price of fixed income securities with longer maturities will increase or decrease more in response to changes in interest rates than shorter-term securities.
Option Overlay Risk. The Fund's use of options involves various risks, including the risk that the options strategy may not provide the desired increase in income or may result in losses. Selling call and put options exposes the Fund to potentially significant losses if market movements are unfavorable. The Fund may also experience additional volatility and risk due to changes in implied volatility (the market's forecast of future volatility), strike prices, and market conditions. The Fund may sell options on instruments other than the Fund's Bond Sector ETFs. This can expose the Fund to the risk that options can vary in price in ways that do not correspond to the Bond Sector ETFs held by the Fund, so called basis-risk.
Interest Rate Risk. Generally, the value of fixed income securities will change inversely with changes in interest rates. As interest rates rise, the market value of fixed income securities tends to decrease. Conversely, as interest rates fall, the market value of fixed income securities tends to increase.
New Fund Risk. The Fund is a recently organized management investment company with no operating history. As a result, prospective investors do not have a track record or history on which to base their investment decisions.
Diversification does not eliminate the risk of experiencing investment losses.
Index Definitions
Bloomberg Barclays US Aggregate Bond Index: A broad-based benchmark that measures the investment grade, US dollar-denominated, fixed-rate taxable bond market. The index includes Treasuries, government-related and corporate securities, MBS (agency fixed-rate and hybrid ARM pass-throughs), ABS and CMBS (agency and non-agency).
US Treasury 7-10 Yr Bond Inversed Index: ICE U.S. Treasury 7-10 Year Bond 1X Inverse Index is designed to provide the inverse of the daily return of the ICE U.S. Treasury 7-10 Year Bond Index (IDCOT7). ICE U.S. Treasury 7-10 Year Bond Index tracks the performance of US dollar denominated sovereign debt publicly issued by the US government in its domestic market. Qualifying securities of the underlying index must have greater than or equal to seven years and less than 10 years remaining term to final maturity as of the rebalancing date, a fixed coupon schedule and an adjusted amount outstanding of at least $300 million.
S&P 500 Index: The S&P 500 Index, or Standard & Poor's 500 Index, is a market-capitalization-weighted index of 500 leading publicly traded companies in the U.S.
IBOXHY Index: iBoxx USD Liquid High Yield Total Return Index measures the USD denominated, sub-investment grade, corporate bond market. The index includes bonds with minimum 1 years to maturity,
minimum amount outstanding of USD 400 mil. Bond type includes fixed-coupon, step-up, bonds with
sinking funds, medium term notes, callable and putable bonds.
Definitions
Alpha: a return achieved above and beyond the return of a benchmark or proxy with a similar risk level.
Annualized Equivalent Yield: represents the annualized yield based on the most recent month of income distribution: (income distribution x 12 months)/price per share.
Basis Points (bps): Is a unit of measure used in quoting yields, changes in yields or differences between yields. One basis point is equal to 0.01%, or one one-hundredth of a percent of yield and 100 basis points equals 1%.
Beta measures: the volatility of a security or portfolio relative to an index. Less than one means lower volatility than the index; more than one means greater volatility.
Convexity: A measure of how the duration of a bond changes in correlation to an interest rate change. The greater the convexity of a bond the greater the exposure of interest rate risk to the portfolio.
Correlation: a statistic that measures the degree to which two securities move in relation to each other.
Coupon: is the annual interest rate paid on a bond, expressed as a percentage of the bond’s face value.
CUSIP: An identifier number that stands for the Committee on Uniform Securities Identification Procedures assigned to stocks and registered bonds in the United States and Canada.
Duration: measures a bond price’s sensitivity to changes in interest rates. The longer a bond’s duration, the higher its sensitivity to changes in interest rates and vice versa.
GNMA: Government National Mortgage Association
FNMA: Federal National Mortgage Association
FHLMC: Federal Home Loan Mortgage Corporation
Short Investment (Shorting): is a position that has been sold with the expectation that it will decrease in value, the intention being to repurchase it later at a lower price.
Distributed by Foreside Fund Services, LLC.