RISR & FIXP Commentary for September
Click here for a pdf version of this commentary.
RISR Performance Summary
The FolioBeyond Alternative Income and Interest Rate Hedge ETF (ticker: RISR) returned ‑1.99% based on the closing market price (-1.09% based on net asset value or “NAV”) in September. In comparison, the ICET7IN Index (US Treasury 7-Year Bond Inverse Index) returned ‑0.70% while the Bloomberg Barclays U.S. Aggregate Bond Index ("AGG") returned 1.13% during the same period.
The performance data quoted represents past performance. Past performance does not guarantee future results. The investment return and principal value of an investment will fluctuate so that an investor’s shares, when sold or redeemed, September be worth more or less than their original cost and current performance September be lower or higher than the performance quoted. Performance current to the most recent month-end can be obtained by calling 866-497-4963. Short-term performance, in particular, is not a good indication of the fund’s future performance, and an investment should not be made based solely on returns. Returns beyond 1 year are annualized.
A fund's NAV is the sum of all its assets less any liabilities, divided by the number of shares outstanding. The market price is the most recent price at which the fund was traded. The fund intends to pay out income, if any, monthly. There is no guarantee that these distributions will be made.
Total Expense Ratio is 1.23%.
For standardized performance click here.
September’s performance can be traced to two important factors and one factor that everyone was watching, but which did not matter. The non-factor was the Fed reducing its Fed Funds target by 25 bps on September 17. This may have been the most “telegraphed punch” in Fed history, so when it came it was mostly a non-event. The two factors that did matter were: 1) the ongoing slow grind lower in longer term interest rates, and 2) the decline in the spread between the Treasury rates and the 30-year fixed rate mortgage coupon. The 10-year has been in a desultory trading range between 4.00% and 4.6% for the past 2 calendar quarters. September closed near the lower end of that range. Over that same time period, the difference between mortgage rates and Treasury rates has compressed materially. At the end of the month this so-called “mortgage spread” was only around 235 bps, which was more than 60 bps tighter than 13 weeks ago. [1]

Source: Bloomberg, LP
The reduction in yields and spreads is of a piece with recent trends across a variety of markets that reflect a relaxed attitude toward certain risks by many investors. This can be seen in ever-rising stock prices as well as the very low spreads between investment grade and below investment grade debt. We believe this attitude is misplaced, as we will discuss further below in the outlook.
During September RISR saw continued capital inflows. Since the beginning of the year, total assets under management have more than doubled. In addition, we observed the 4th anniversary since the launch of the Fund in 2021. As the fund continues to grow, and reach important longevity milestones, we are hopeful this will allow the fund to be added to a number of larger investment platforms that have minimum AUM and aging requirements. Many affiliated and independent RIAs are managed on such platforms, including e.g. LPL, and are limited to buying ETFs available on those platforms. We were very pleased to obtain access to Fidelity’s platform (where Fidelity Institutional Wealth Advisor (FIWA) has upgraded RISR to its ‘Meets-Quantitative’ rating), and have begun connecting with their advisors to discuss RISR’s suitability for their clients.
RISR - Total Fund Assets ($ millions)

Portfolio composition has not changed meaningfully over the past several months. We continue to hold a mix of coupons, with the largest portions between 3.0-4.0%.
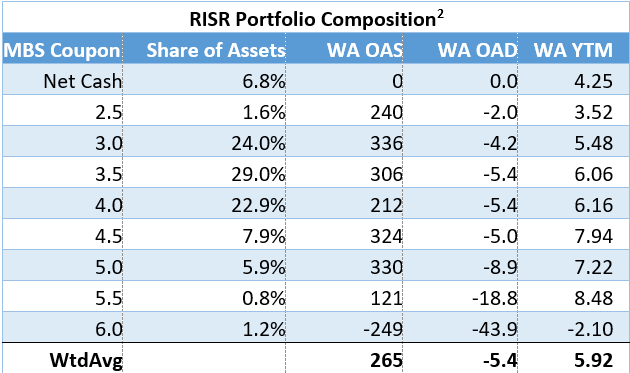
The option-adjusted measures shown in the table above, are based on Bloomberg’s mortgage prepayment model. In addition to that model, we also make use of another industry standard model called Yieldbook. There can be material differences in the results from those models. In particular, the very negative OAD values shown for 5.5-6% coupon mortgage are much smaller in magnitude when running Yieldbook. Nevertheless, the table gives an indication of how risk and return vary across different mortgage rates for the MBS IOs held. It is also important to recognize the values shown in the table are based on current market values supplied by our valuation vendor. Many of RISR’s current holdings were purchased quite some time ago, and often at much lower prices than their current market values. Consequently, the OAS, OAD and YTM values shown do not necessarily reflect the returns achieved since each security was originally purchased. Having said that, in the current market environment, we are aiming for an OAD of around -5, OAS in the 250-300 bps range, and a yield of around 6.25-6.5%. Based on those goals, we are very close to our overall portfolio targets.
FIXP Performance Summary
FolioBeyond’s Enhanced Fixed Income Premium ETF (ticker: “FIXP”) seeks to provide income and, secondarily, long-term capital appreciation. The Fund invests in a portfolio of ETFs representing certain sectors of the fixed income market. In addition, the Fund seeks to generate additional income by writing options on these same ETFs, or other ETFs we believe have attractive prices and desirable correlation and volatility characteristics.
For the month of September, FIXP returned 0.28% (0.28% based on NAV), to bring the YTD return to 2.2%. The portfolio holdings were reallocated during the month, as follows:

The changes in portfolio composition resulted from the fund’s dynamic reallocation model. Changes are made based on volatility, momentum, yield, default risk, and other factors and occur based on market observations rather than a fixed schedule. For the last handful of reallocations most of the changes have been between REM and SJNK. This is not surprising given the volatile and shifting environment for real estate assets (REM), on the one hand, vs. high-yield corporates (SJNK), on the other.
The performance data quoted represents past performance. Past performance does not guarantee future results. The investment return and principal value of an investment will fluctuate so that an investor’s shares, when sold or redeemed, September be worth more or less than their original cost and current performance and September be lower or higher than the performance quoted. Performance current to the most recent month-end can be obtained by calling 866-497-4963. Short-term performance, in particular, is not a good indication of the fund’s future performance, and an investment should not be made based solely on returns. Returns beyond 1 year are annualized.
A fund's NAV is the sum of all its assets less any liabilities, divided by the number of shares outstanding. The market price is the most recent price at which the fund was traded. The fund intends to pay out income, if any, monthly. There is no guarantee that these distributions will be made.
Total Expense Ratio is 1.07%.
For FIXP standardized performance and fund holdings click here.
FIXP’s option holdings contributed minimally to September’s total return, due to low implied volatility in the slightly out of the money options we wrote against our underlying holdings. We continue to explore ways to enhance option premium income despite low premiums generally being paid for such options in the current environment.
The allocation model that FIXP uses has been running for private clients and model portfolios for more than three years, and we are very excited to be bringing this advanced algorithm to ETF investors. Please reach out to us to learn more and to obtain detailed information and fund documents.
Market Outlook
September continued the somewhat schizophrenic market action that has characterized the US for most of the year. A number of important indicators seem to be suggesting a slowing in economic activity. This has been seen most directly in the labor market, where hiring trends have slowed, and earlier reports suggesting robust growth were revised down materially. Still, the overall unemployment rate is still running at around 4.2%, which traditionally would have been considered “full employment.” And overall economic growth remains relatively robust, with GDP growth predicted to be around 3.3% for all of 2025.
One “X-factor” that seems to be making the picture a little murky is that a very large number of undocumented workers have left the US voluntarily in 2025, perhaps in excess of one million.[3] These workers were concentrated in a handful of industries, including construction and hospitality, both of which have slowed meaningfully. However, labor market slowdowns have also spread to Professional and Business Services, and especially Government. Some might point to technology developments, including AI, as a driver for the Services slowdown, and there has been a drop in computer and systems jobs growth. But the more significant slowdown has come in the Government sector, where the Trump Administration has sought the shrink the size of the federal workforce, initially through DOGE, but ongoing as well. In 2024 nearly a quarter of all new jobs were in the government sector. So far in 2025 that figure is below 2%.
These two facts—massive self-deportations and a sharp decline in Government hiring—make it extremely difficult to discern the true economic trends for private-sector labor markets. In resuming cuts to the Federal Fund rate, Fed Chair Powell pointed to a softening labor market as a justification. But there are many observers, including our team, who believe it is far too early to pivot to a focus on employment, while the numbers are mixed, and inflation remains well above the Fed’s stated 2%. target.

It is also worth pointing out that labor markets had taken a massive rebound after Covid, and that some sort of moderation was inevitable. The growth in jobs in 2021-2024 was by far the fastest growth ever recorded for a 4-year period. Much of those gains were replacing the nearly 9 million jobs lost during 2020. If we were to annualize the 2025 job growth based on YTD, it would put us at around 900 thousand, which is on the lower end of the usual range, but hardly crisis level. Moreover, during 2021-2024 there was a massive inflow of undocumented workers, perhaps as many as 4-5 million.

In short, it is impossible to say with confidence what is the state of the labor market currently. All that can be said is that it is weaker than it had been, but that is about as much as can be confidently concluded as of today. We believe the Fed has mis-read the situation.
At the same time, certain high-profile assets have continued a remarkable climb, including tech/AI stocks, crypto-currencies and gold. All three have been on a nearly relentless rally since around the beginning of 2023. In that time, the so-called Magnificent 7 tech stocks have increased by more than 300%, bitcoin has increased by more than 575%, and gold has more than doubled, with much of that move coming in the last six months.

This has prompted widespread discussion of whether these specific assets, or financial assets generally, are in a “bubble.” While not as dramatic, we have also seen sharp contraction in credit spreads, a rapid growth in private, mostly unregulated non-bank lending, and other signs of frothiness. In light of this, one could be forgiven for thinking a loosening of financial conditions by the Fed might be ill-advised. But apparently, the Fed is choosing to look through these financial signals.
It is, of course, possible that underlying labor market weakness is worse than it appears currently. The potential inflationary impact from tariffs is likewise still unclear. There would seem to be little harm in waiting a bit to ascertain whether that is true.[4] But the political pressure on the Fed has been extreme, and it is surely having an effect. The risk is that by lowering rates and loosening financial conditions, the Fed risks re-igniting inflation, at a time when it shows signs of rising again, even without the Fed’s help. Given the asymmetric risks to inflation vs employment, we strongly believe that the Fed pivoting to a more dovish posture today is bordering on reckless.
There is a prudent, well-established playbook for this type of environment. Protect your capital and look for investments that generate current cash income. Trying to trade the news or time the markets in such an environment is reckless in the extreme. The news will always be faster and more unpredictable that you are as an investor.
Please contact us to explore how RISR and FIXP might fit into your overall strategy, to help you manage risk while generating an attractive current yield.

[1] The spread is commonly computed as a difference of the mortgage rate over the average of the 5-year and 10-year US Treasury yield.
[2] WA OAS: Weighted average option adjusted spread; WA OA: Weighted average option adjusted duration; WA YTM: Weighted average yield to maturity.
[3] This excludes government-initiated deportations, which despite significant public attention, have been de minimus in the context of the overall labor market.
[4] As of this writing, the shutdown of the Federal government has delayed the release of some important economic statistics, including some related to jobs. One has to assume this will get resolved in due course, as it always has in the past. If not, there will be bigger problems.
Portfolio Applications
We believe RISR and FIXP can provide attractive, thematic strategies that provide strong correlation benefits for both fixed income and equity portfolios. They can be utilized as part of a core holdings for diversified portfolios or as an overlay to manage the risks of fixed income portfolios. RISR can be used as a macro hedge against rising interest rates with less exposure to equity beta and negative correlation to fixed income beta. The underlying bonds are all U.S. agency credit that are guaranteed by FNMA, FHLMC or GNMA. Also, timing is on our side as the strategy generates current income if interest rates were to remain within a trading range. FIXP offers a broadly diversified exposure to multiple sectors of the fixed income markets in an algorithmically optimized manner.
Please contact us to explore how RISR and FIXP can be utilized as a unique tool to adjust your portfolio allocations in the current high volatility environment.
| Yung Lim | Dean Smith | George Lucaci |
|---|---|---|
| Chief Executive Officer | Chief Strategist and Marketing Officer | Global Head of Distribution |
| Chief Investment Officer | RISR Portfolio Manager | |
| ylim@foliobeyond.com | dsmith@foliobeyond.com | glucaci@foliobeyond.com |
| 917-892-9075 | 914-523-2180 | 908-723-3372 |
This material must be preceded or accompanied by a prospectus. For a copy of the prospectus please click here for RISR and here for FIXP.
Investments involve risk. Principal loss is possible. Unlike mutual funds, ETFs trade at a premium or discount to their net asset value. The fund is new and has limited operating history to judge fund risks. The value of MBS IOs is more volatile than other types of mortgage related securities. They are very sensitive not only to declining interest rates, but also to the rate of prepayments. MBS IOs involve the risk that borrowers default on their mortgage obligations or the guarantees underlying the mortgage-backed securities will default or otherwise fail and that, during periods of falling interest rates, mortgage-backed securities will be called or prepaid, which result in the Fund having to reinvest proceeds in other investments at a lower interest rate.
The Fund’s derivative investments have risks, including the imperfect correlation between the value of such instruments and the underlying assets or index; the loss of principal, including the potential loss of amounts greater than the initial amount invested in the derivative instrument. The value of the Fund’s investments in fixed income securities (not including MBS IOs) will fluctuate with changes in interest rates. Typically, a rise in interest rates causes a decline in the value of fixed income securities owned indirectly by the Fund. Please see the prospectus for a complete description of principal risks.
The Morningstar Rating™ for funds, or "star rating," is calculated for managed products (including mutual funds, variable annuity and variable life subaccounts, exchange-traded funds, closed-end funds and separate accounts) with at least a three-year history without adjustment for sales load. Exchange-traded funds and open-ended mutual funds are considered a single population for comparative purposes. It is calculated based on a Morningstar Risk- Adjusted Return measure that accounts for variation in a managed product's monthly excess performance, placing more emphasis on downward variations and rewarding consistent performance. The top 10% of products in each product category receive five stars, the next 22.5% receive four stars, the next 35% receive three stars, the next 22.5% receive two stars, and the bottom 10% receive one star. The Overall Morningstar Rating™ for a managed product is derived from a weighted average of the performance figures associated with its three-, five- and 10-year (if applicable) Morningstar Rating™ metrics. The weights are: 100% three-year rating for 36 - 59 months of total returns, 60% five-year rating/40% three-year rating for 60 - 119 months of total returns, and 50% 10-year rating/30% five-year rating/20% three-year rating for 120 or more months of total returns. While the 10-year overall star rating formula seems to give the most weight to the 10-year period, the most recent three-year period actually has the greatest impact because it is included in all three rating periods. As of 9/30/2024, RISR was rated against the following number of Nontraditional Bond Funds over the following periods: 272 for the 3-year time period. RISR received 5 stars for those periods. Ratings for other share classes September differ. Past performance is no guarantee of future results.
FIXP Risks
Underlying ETFs Risks. The Fund will incur higher and duplicative expenses because it invests in underlying ETFs, including Bond Sector ETFs and broad-based bond ETFs (collectively, “Underlying ETFs”). There is also the risk that the Fund may suffer losses due to the investment practices of the Underlying ETFs. The Fund will be subject to substantially the same risks as those associated with the direct ownership of securities held by the Underlying ETFs.
Fixed Income Risk. The prices of fixed income securities respond to economic developments, particularly interest rate changes, as well as to changes in an issuer's credit rating or market perceptions about the creditworthiness of an issuer. In general, the market price of fixed income securities with longer maturities will increase or decrease more in response to changes in interest rates than shorter-term securities.
Option Overlay Risk. The Fund's use of options involves various risks, including the risk that the options strategy may not provide the desired increase in income or may result in losses. Selling call and put options exposes the Fund to potentially significant losses if market movements are unfavorable. The Fund may also experience additional volatility and risk due to changes in implied volatility (the market's forecast of future volatility), strike prices, and market conditions. The Fund may sell options on instruments other than the Fund's Bond Sector ETFs. This can expose the Fund to the risk that options can vary in price in ways that do not correspond to the Bond Sector ETFs held by the Fund, so called basis-risk.
Interest Rate Risk. Generally, the value of fixed income securities will change inversely with changes in interest rates. As interest rates rise, the market value of fixed income securities tends to decrease. Conversely, as interest rates fall, the market value of fixed income securities tends to increase.
New Fund Risk. The Fund is a recently organized management investment company with no operating history. As a result, prospective investors do not have a track record or history on which to base their investment decisions.
Diversification does not eliminate the risk of experiencing investment losses.
Index Definitions
Bloomberg Barclays US Aggregate Bond Index: A broad-based benchmark that measures the investment grade, US dollar-denominated, fixed-rate taxable bond market. The index includes Treasuries, government-related and corporate securities, MBS (agency fixed-rate and hybrid ARM pass-throughs), ABS and CMBS (agency and non-agency).
US Treasury 7-10 Yr Bond Inversed Index: ICE U.S. Treasury 7-10 Year Bond 1X Inverse Index is designed to provide the inverse of the daily return of the ICE U.S. Treasury 7-10 Year Bond Index (IDCOT7). ICE U.S. Treasury 7-10 Year Bond Index tracks the performance of US dollar denominated sovereign debt publicly issued by the US government in its domestic market. Qualifying securities of the underlying index must have greater than or equal to seven years and less than 10 years remaining term to final maturity as of the rebalancing date, a fixed coupon schedule and an adjusted amount outstanding of at least $300 million.
S&P 500 Index: The S&P 500 Index, or Standard & Poor's 500 Index, is a market-capitalization-weighted index of 500 leading publicly traded companies in the U.S.
IBOXHY Index: iBoxx USD Liquid High Yield Total Return Index measures the USD denominated, sub-investment grade, corporate bond market. The index includes bonds with minimum 1 years to maturity,
minimum amount outstanding of USD 400 mil. Bond type includes fixed-coupon, step-up, bonds with
sinking funds, medium term notes, callable and putable bonds.
Definitions
Alpha: a return achieved above and beyond the return of a benchmark or proxy with a similar risk level.
Annualized Equivalent Yield: represents the annualized yield based on the most recent month of income distribution: (income distribution x 12 months)/price per share.
Basis Points (bps): Is a unit of measure used in quoting yields, changes in yields or differences between yields. One basis point is equal to 0.01%, or one one-hundredth of a percent of yield and 100 basis points equals 1%.
Beta measures: the volatility of a security or portfolio relative to an index. Less than one means lower volatility than the index; more than one means greater volatility.
Convexity: A measure of how the duration of a bond changes in correlation to an interest rate change. The greater the convexity of a bond the greater the exposure of interest rate risk to the portfolio.
Correlation: a statistic that measures the degree to which two securities move in relation to each other.
Coupon: is the annual interest rate paid on a bond, expressed as a percentage of the bond’s face value.
CUSIP: An identifier number that stands for the Committee on Uniform Securities Identification Procedures assigned to stocks and registered bonds in the United States and Canada.
Duration: measures a bond price’s sensitivity to changes in interest rates. The longer a bond’s duration, the higher its sensitivity to changes in interest rates and vice versa.
GNMA: Government National Mortgage Association
FNMA: Federal National Mortgage Association
FHLMC: Federal Home Loan Mortgage Corporation
Short Investment (Shorting): is a position that has been sold with the expectation that it will decrease in value, the intention being to repurchase it later at a lower price.
Distributed by Foreside Fund Services, LLC.