RISR & FIXP Commentary for August
Click here for a pdf version of this commentary.
RISR Performance Summary
The FolioBeyond Alternative Income and Interest Rate Hedge ETF (ticker: RISR) returned 0.70% based on the closing market price (0.76% based on net asset value or “NAV”) in August. In comparison, the ICET7IN Index (US Treasury 7-Year Bond Inverse Index) returned -1.63% while the Bloomberg Barclays U.S. Aggregate Bond Index ("AGG") returned 1.20% during the same period.
The performance data quoted represents past performance. Past performance does not guarantee future results. The investment return and principal value of an investment will fluctuate so that an investor’s shares, when sold or redeemed, may be worth more or less than their original cost and current performance may be lower or higher than the performance quoted. Performance current to the most recent month-end can be obtained by calling 866-497-4963. Short-term performance, in particular, is not a good indication of the fund’s future performance, and an investment should not be made based solely on returns. Returns beyond 1 year are annualized.
A fund's NAV is the sum of all its assets less any liabilities, divided by the number of shares outstanding. The market price is the most recent price at which the fund was traded. The fund intends to pay out income, if any, monthly. There is no guarantee that these distributions will be made.
Total Expense Ratio is 1.23%.
For standardized performance click here.
Jay Powell can’t seem to catch a break. Just when it seemed like the labor market was on solid ground, so the Fed could focus on getting inflation to its 2% target, a number of large revisions to previously reported numbers scrambled that plan. Revisions to jobs numbers occur all the time, but the magnitude of these revisions called into question basic beliefs about the strength of the labor market for all of 2025, and even 2024.
The revisions were so large that Powell was forced to address the jobs weakness directly in his annual Jackson Hole conference remarks on August 22. In doing so, he opened the door to the potential resumption of rate cuts beginning at the upcoming September FOMC meeting. This was a very different tone than the remarks he had made just a few weeks earlier when the FOMC decided to hold rates steady at their meeting on July 29-30. This meant that despite inflation holding stubbornly above the target, the Fed would now have to weigh the risks of higher unemployment at the same time convincing markets they would not abandon the fight against rising prices.
Markets didn’t see it that way, and a significant rally in bonds was soon underway. Between July 18, just before the Jackson Hole speech, and August 1, the 10-year Treasury yield dropped by 25 bps. In addition to the new focus on labor markets, Powell also announced a revised Fed policy framework, which many interpreted as softening the Fed’s stated goal to actually bring realized inflation to their target, in favor of an emphasis on managing inflation expectations.
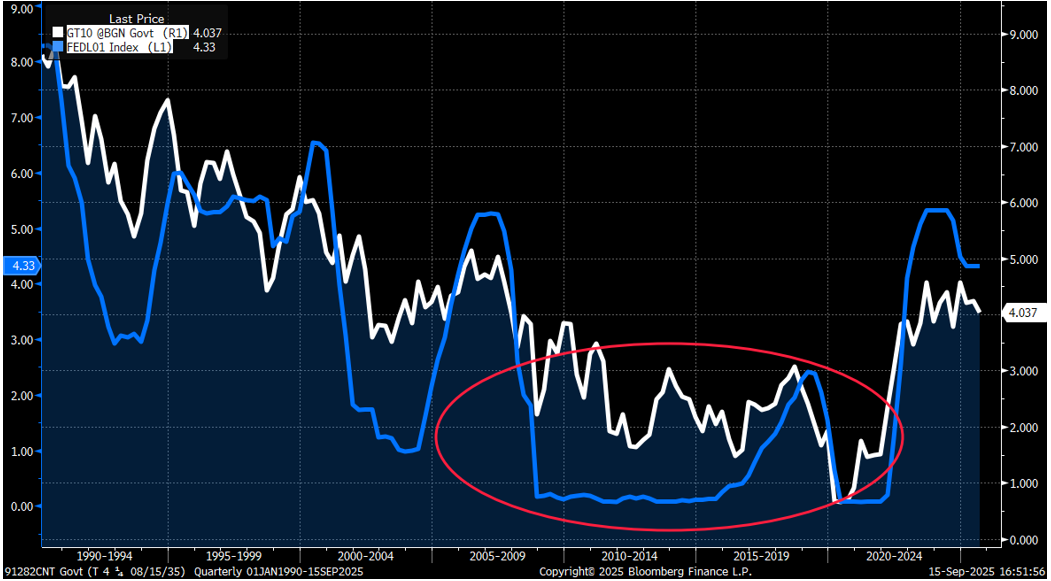
Despite this, RISR still managed to produce a positive return for the month, which continues a trend of relative outperformance during these “bear market rallies,” which we believe accurately describes these reactive declines in rates that have tended to be fairly quickly reversed, as the chart below reflects.

Source: Bloomberg, LP
While we do not attempt to time the market, we do aim to manage the fund intelligently in line with medium-term trends. For example, since the launch of the fund in 2021, we have reduced our target duration from around -7, to its current roughly -5 today. This has allowed us to continue to benefit from a moderation in the pace of longer-term interest rate trends, while maintaining a strong focus on reducing overall return volatility. This means that RISR can continue to operate as an effective risk reduction tool against interest rate volatility, while striving to deliver an attractive current dividend. In short, the RISR strategy is working as designed and we are pleased with the performance even as the Fed reduced rates by 100 bps last year, and seems poised to resume rate cuts as we head into the final quarter of 2025. If the yield curve continues to steepen as it generally has been, we would expect this pattern to continue.
Asset growth was modest in August, but this is not unexpected as late summer winds down. We are hopeful that we will resume our continued asset growth as investors return from vacations, and hoping we can continue to produce returns consistent with our exceptional Morningstar ranking of #1 out of 241 Nontraditional Bond Funds for the 3-year period ended 8/31/2025.

FIXP Performance Summary
FolioBeyond’s Enhanced Fixed Income Premium ETF (ticker: “FIXP”) seeks to provide income and, secondarily, long-term capital appreciation. The Fund invests in a portfolio of ETFs representing certain sectors of the fixed income market. In addition, the Fund seeks to generate additional income by writing options on these same ETFs, or other ETFs we believe have attractive prices and desirable correlation and volatility characteristics.
For the month, FIXP returned 1.34% (1.35% based on NAV), which once again beat the AGG return of 1.20%. The portfolio holdings were reallocated during the month, as follows:
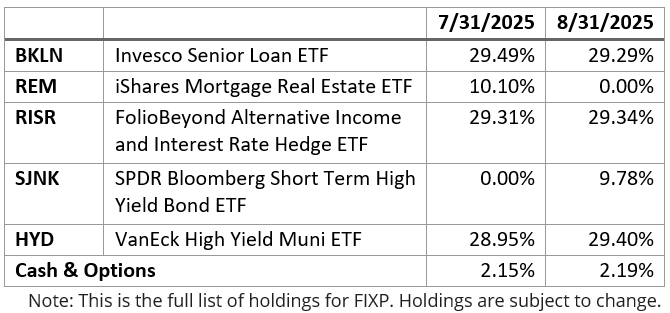
The changes in portfolio composition resulted from the fund’s dynamic reallocation model. Changes are made based on volatility, momentum, yield, default risk, and other factors and occur based on market observations rather than a fixed schedule. Shares of REM were sold and replaced with a like amount of SJNK. This had the effect of reducing exposure to real estate in favor of an increase in short-term (under 5-year maturity) high yield corporate credit.
The performance data quoted represents past performance. Past performance does not guarantee future results. The investment return and principal value of an investment will fluctuate so that an investor’s shares, when sold or redeemed, August be worth more or less than their original cost and current performance and August be lower or higher than the performance quoted. Performance current to the most recent month-end can be obtained by calling 866-497-4963. Short-term performance, in particular, is not a good indication of the fund’s future performance, and an investment should not be made based solely on returns. Returns beyond 1 year are annualized.
A fund's NAV is the sum of all its assets less any liabilities, divided by the number of shares outstanding. The market price is the most recent price at which the fund was traded. The fund intends to pay out income, if any, monthly. There is no guarantee that these distributions will be made.
Total Expense Ratio is 1.07%.
For FIXP standardized performance and fund holdings click here.
FIXP’s option holdings contributed minimally to August’s total return, due to low implied volatility in the slightly out of the money options we wrote against our underlying holdings. We continue to explore ways to enhance option premium income despite low premiums generally being paid for such options in the current environment.
The allocation model that FIXP uses has been running for private clients and model portfolios for more than three years, and we are very excited to be bringing this advanced algorithm to ETF investors. Please reach out to us to learn more and to obtain detailed information and fund documents.
Market Outlook
While it may be asking too much to expect perfect consistency between economic signals, the conflict between key indicators seems to be reaching some kind of record. Here is a table highlighting some of the anomalies:

We could go on, but the picture is clear: there is a great deal of uncertainty about the future path of the US economy, inflation and interest rates. A period of slowing growth and rising prices—stagflation—is a real concern among many analysts, investors, businesses and households. The ongoing, highly chaotic flow of policy announcements from the trump Administration has not helped matters.
The unrelenting political pressure on the Federal Reserve to reduce interest rates seems to be having an effect. But as we have discussed in the past, a reduction in the overnight Fed Funds rate does not always lead to reductions in the far more economically important medium- and longer-term rates. For instance, commercial and residential mortgage rates are far more dependent on 10-year and longer rates. Corporate bonds are likewise issued for maturities as long as 30 years. The Fed has far less control over those rates.
Moreover, there is a growing understanding that the extraordinary measures the Fed took in response to the financial crisis of 2008 and then again in response to covid, have had profound and deeply negative effects on households and small businesses, even as they greatly favored the financial sector, large investors and highly levered businesses such as private equity. Indeed, the zero-interest rate policy that persisted from around 2010-2021 is now understood to have generated a massive generational transfer of wealth that will be extremely difficult to reverse, if it is even possible at all.
10-year Treasury Yield (white) v Fed Funds (blue)
As a result of this, the policy choices made by Congress, and White House and the Fed over the next several quarters and years will be highly consequential. So far, the initial readings are mixed, at best, and most lean in the direction of higher inflation and higher interest rates over time.
The so-called “One Big Beautiful Bill” recently passed will undoubtedly cause a significant increase in debt and deficits for many years to come. The tariffs imposed so far have faced comparatively little resistance from domestic interests, who are perhaps fearful of the political repercussions of public statements against Administration policies. Some federal court decisions have created a modest head-wind, but the Administration seems not overly concerned because they believe they have sufficient authority to keep the tariffs in place despite some early court losses. It is very early innings in this battle.
Housing prices have reached the lowest levels of affordability on record, based principally on a long-standing shortage of new home construction, for which no serious remedies have been proposed by government policy makers. The ultimate passing of the baby boom generation may free up some of the housing stock, but much of that is functionally obsolescent and is well-located geographically for a population that has been moving south and west and will likely continue to do so.
Some optimists point to the benefits of AI as a palliative to our near-term growth and distributional problems, but those benefits look to be much further off than can reasonably be predicted, as well as highly concentrated, and the most frequently proposed solution for the massively displaced work-force is some form of basic income that is, so-far at least, very ill-defined and politically infeasible.
In the face of these and numerous other pressing economic and social policy stresses, the only solution coming from Washington for now is for the Fed to again start cutting interest rates. This is not remotely sufficient to address the challenges we face. Artificially repressed nominal interest rates can easily lead to negative real rates in the short run, which historically has produced inflation and ultimately higher nominal rates. Indeed, we just had a preview of that, and it was not a positive experience. If that is the best idea policy-makers have to offer, one should expect persistent volatility, high risk premiums and ongoing disruptions to business models, trade and supply chains.
There is a prudent, well-established playbook for this type of environment. Preserve your capital and look for investments that generate current cash income. Trying to trade the news or time the markets in such an environment is reckless in the extreme. The news will always be faster and more unpredictable than you are as an investor.
Please contact us to explore how RISR and FIXP might fit into your overall strategy, to help you manage risk while generating an attractive current yield.

Portfolio Applications
We believe RISR and FIXP can provide attractive, thematic strategies that provide strong correlation benefits for both fixed income and equity portfolios. They can be utilized as part of a core holdings for diversified portfolios or as an overlay to manage the risks of fixed income portfolios. RISR can be used as a macro hedge against rising interest rates with less exposure to equity beta and negative correlation to fixed income beta. The underlying bonds are all U.S. agency credit that are guaranteed by FNMA, FHLMC or GNMA. Also, timing is on our side as the strategy generates current income if interest rates were to remain within a trading range. FIXP offers a broadly diversified exposure to multiple sectors of the fixed income markets in an algorithmically optimized manner.
Please contact us to explore how RISR and FIXP can be utilized as a unique tool to adjust your portfolio allocations in the current high volatility environment.
| Yung Lim | Dean Smith | George Lucaci |
|---|---|---|
| Chief Executive Officer | Chief Strategist and Marketing Officer | Global Head of Distribution |
| Chief Investment Officer | RISR Portfolio Manager | |
| ylim@foliobeyond.com | dsmith@foliobeyond.com | glucaci@foliobeyond.com |
| 917-892-9075 | 914-523-2180 | 908-723-3372 |
This material must be preceded or accompanied by a prospectus. For a copy of the prospectus please click here for RISR and here for FIXP. Please read the prospectus carefully before investing.
Investments involve risk. Principal loss is possible. Unlike mutual funds, ETFs trade at a premium or discount to their net asset value. The fund is new and has limited operating history to judge fund risks. The value of MBS IOs is more volatile than other types of mortgage related securities. They are very sensitive not only to declining interest rates, but also to the rate of prepayments. MBS IOs involve the risk that borrowers default on their mortgage obligations or the guarantees underlying the mortgage-backed securities will default or otherwise fail and that, during periods of falling interest rates, mortgage-backed securities will be called or prepaid, which result in the Fund having to reinvest proceeds in other investments at a lower interest rate.
The Fund’s derivative investments have risks, including the imperfect correlation between the value of such instruments and the underlying assets or index; the loss of principal, including the potential loss of amounts greater than the initial amount invested in the derivative instrument. The value of the Fund’s investments in fixed income securities (not including MBS IOs) will fluctuate with changes in interest rates. Typically, a rise in interest rates causes a decline in the value of fixed income securities owned indirectly by the Fund. Please see the prospectus for a complete description of principal risks.
The Morningstar Rating™ for funds, or "star rating," is calculated for managed products (including mutual funds, variable annuity and variable life subaccounts, exchange-traded funds, closed-end funds and separate accounts) with at least a three-year history without adjustment for sales load. Exchange-traded funds and open-ended mutual funds are considered a single population for comparative purposes. It is calculated based on a Morningstar Risk- Adjusted Return measure that accounts for variation in a managed product's monthly excess performance, placing more emphasis on downward variations and rewarding consistent performance. The top 10% of products in each product category receive five stars, the next 22.5% receive four stars, the next 35% receive three stars, the next 22.5% receive two stars, and the bottom 10% receive one star. The Overall Morningstar Rating™ for a managed product is derived from a weighted average of the performance figures associated with its three-, five- and 10-year (if applicable) Morningstar Rating™ metrics. The weights are: 100% three-year rating for 36 - 59 months of total returns, 60% five-year rating/40% three-year rating for 60 - 119 months of total returns, and 50% 10-year rating/30% five-year rating/20% three-year rating for 120 or more months of total returns. While the 10-year overall star rating formula seems to give the most weight to the 10-year period, the most recent three-year period actually has the greatest impact because it is included in all three rating periods. As of 9/30/2024, RISR was rated against the following number of Nontraditional Bond Funds over the following periods: 272 for the 3-year time period. RISR received 5 stars for those periods. Ratings for other share classes August differ. Past performance is no guarantee of future results.
Morningstar classifies funds into categories based on similar investment objective and strategy. Morningstar percentile rankings are based on a fund's total return compared to its Morningstar Category of exchange-traded and open-end mutual funds. The highest percentile rank is 1 and the lowest percentile rank is 100.
FIXP Risks
Underlying ETFs Risks. The Fund will incur higher and duplicative expenses because it invests in underlying ETFs, including Bond Sector ETFs and broad-based bond ETFs (collectively, “Underlying ETFs”). There is also the risk that the Fund may suffer losses due to the investment practices of the Underlying ETFs. The Fund will be subject to substantially the same risks as those associated with the direct ownership of securities held by the Underlying ETFs.
Fixed Income Risk. The prices of fixed income securities respond to economic developments, particularly interest rate changes, as well as to changes in an issuer's credit rating or market perceptions about the creditworthiness of an issuer. In general, the market price of fixed income securities with longer maturities will increase or decrease more in response to changes in interest rates than shorter-term securities.
Option Overlay Risk. The Fund's use of options involves various risks, including the risk that the options strategy may not provide the desired increase in income or may result in losses. Selling call and put options exposes the Fund to potentially significant losses if market movements are unfavorable. The Fund may also experience additional volatility and risk due to changes in implied volatility (the market's forecast of future volatility), strike prices, and market conditions. The Fund may sell options on instruments other than the Fund's Bond Sector ETFs. This can expose the Fund to the risk that options can vary in price in ways that do not correspond to the Bond Sector ETFs held by the Fund, so called basis-risk.
Interest Rate Risk. Generally, the value of fixed income securities will change inversely with changes in interest rates. As interest rates rise, the market value of fixed income securities tends to decrease. Conversely, as interest rates fall, the market value of fixed income securities tends to increase.
New Fund Risk. The Fund is a recently organized management investment company with no operating history. As a result, prospective investors do not have a track record or history on which to base their investment decisions.
Diversification does not eliminate the risk of experiencing investment losses.
Index Definitions
Bloomberg Barclays US Aggregate Bond Index: A broad-based benchmark that measures the investment grade, US dollar-denominated, fixed-rate taxable bond market. The index includes Treasuries, government-related and corporate securities, MBS (agency fixed-rate and hybrid ARM pass-throughs), ABS and CMBS (agency and non-agency).
US Treasury 7-10 Yr Bond Inversed Index: ICE U.S. Treasury 7-10 Year Bond 1X Inverse Index is designed to provide the inverse of the daily return of the ICE U.S. Treasury 7-10 Year Bond Index (IDCOT7). ICE U.S. Treasury 7-10 Year Bond Index tracks the performance of US dollar denominated sovereign debt publicly issued by the US government in its domestic market. Qualifying securities of the underlying index must have greater than or equal to seven years and less than 10 years remaining term to final maturity as of the rebalancing date, a fixed coupon schedule and an adjusted amount outstanding of at least $300 million.
S&P 500 Index: The S&P 500 Index, or Standard & Poor's 500 Index, is a market-capitalization-weighted index of 500 leading publicly traded companies in the U.S.
IBOXHY Index: iBoxx USD Liquid High Yield Total Return Index measures the USD denominated, sub-investment grade, corporate bond market. The index includes bonds with minimum 1 years to maturity,
minimum amount outstanding of USD 400 mil. Bond type includes fixed-coupon, step-up, bonds with
sinking funds, medium term notes, callable and putable bonds.
Definitions
Alpha: a return achieved above and beyond the return of a benchmark or proxy with a similar risk level.
Annualized Equivalent Yield: represents the annualized yield based on the most recent month of income distribution: (income distribution x 12 months)/price per share.
Basis Points (bps): Is a unit of measure used in quoting yields, changes in yields or differences between yields. One basis point is equal to 0.01%, or one one-hundredth of a percent of yield and 100 basis points equals 1%.
Beta measures: the volatility of a security or portfolio relative to an index. Less than one means lower volatility than the index; more than one means greater volatility.
Convexity: A measure of how the duration of a bond changes in correlation to an interest rate change. The greater the convexity of a bond the greater the exposure of interest rate risk to the portfolio.
Correlation: a statistic that measures the degree to which two securities move in relation to each other.
Coupon: is the annual interest rate paid on a bond, expressed as a percentage of the bond’s face value.
CUSIP: An identifier number that stands for the Committee on Uniform Securities Identification Procedures assigned to stocks and registered bonds in the United States and Canada.
Duration: measures a bond price’s sensitivity to changes in interest rates. The longer a bond’s duration, the higher its sensitivity to changes in interest rates and vice versa.
GNMA: Government National Mortgage Association
FNMA: Federal National Mortgage Association
FHLMC: Federal Home Loan Mortgage Corporation
Short Investment (Shorting): is a position that has been sold with the expectation that it will decrease in value, the intention being to repurchase it later at a lower price.
Distributed by Foreside Fund Services, LLC.