
Click here for a pdf version of this commentary.
RISR Performance Summary
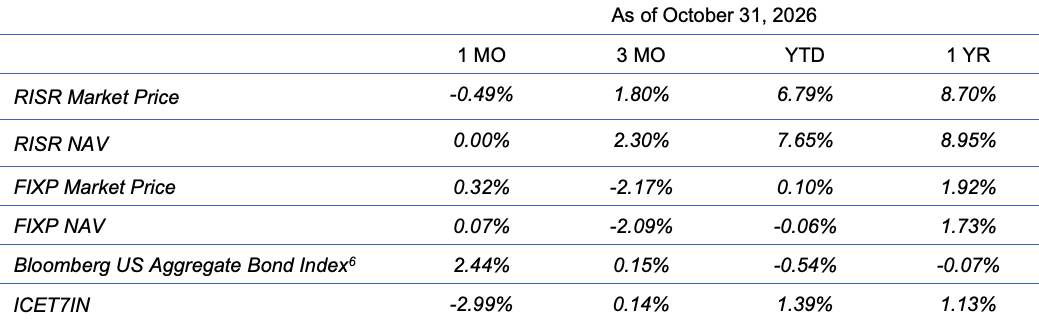
The FolioBeyond Alternative Income and Interest Rate Hedge ETF (ticker: RISR) returned -0.49%% based on the closing market price (0.00% based on net asset value or “NAV”) in October. In comparison, the ICET7IN Index (US Treasury 7-Year Bond Inverse Index) returned -2.99% while the Bloomberg Barclays U.S. Aggregate Bond Index ("AGG") returned 2.44% during the same period. The monthly distribution paid was $0.18 per share on a closing share price of $36.70, which translates to a 5.89% annualized dividend yield.
The performance data quoted represents past performance. Past performance does not guarantee future results. The investment return and principal value of an investment will fluctuate so that an investor’s shares, when sold or redeemed, may be worth more or less than their original cost and current performance may be lower or higher than the performance quoted. Performance current to the most recent month-end can be obtained by calling 866-497-4963. Short-term performance, in particular, is not a good indication of the fund’s future performance, and an investment should not be made based solely on returns. Returns beyond 1 year are annualized.
A fund's NAV is the sum of all its assets less any liabilities, divided by the number of shares outstanding. The market price is the most recent price at which the fund was traded. The fund intends to pay out income, if any, monthly. There is no guarantee that these distributions will be made.
Total Expense Ratio is 1.04%.
For standardized performance click here.
The rising interest rate trend that began at the start of 2022 took a sharp reversal in October, with the 10-year US Treasury bond yield sliding more than 35 bps. This retraced almost ¾ of the 49 bps increase observed the prior month. The most common explanation for the turnaround was increasing skepticism over the durability of the artificial intelligence (“AI”) growth story that has dominated markets for the last few years. This narrative won the battle over higher energy prices and hot YoY inflation prints for both consumer price index (“CPI”) and producer price index (“PPI”), of 3.7% and 6.3%, respectively for September. This push-pull economic environment, plus the upcoming mid-term elections on November 3, caused the Federal Reserve to make no change in its Fed Funds policy rate, although there were two dissenting votes in favor of a hike.
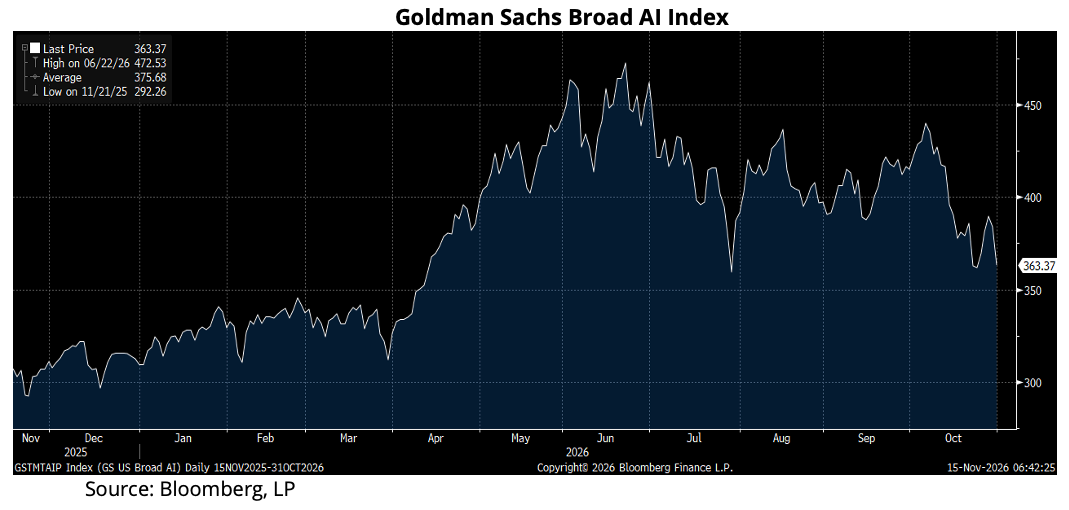
The AI trend is especially notable because there was no single obvious catalyst, but an apparently sudden recognition by investors that their portfolios were overly concentrated on that bet. Animal spirits being what they are, this led to a sharp selloff in AI-related shares, and a rotation into government bonds as a safe haven. Panic may be too strong a word to describe the newfound search for safety, but there was a definite sense of urgency to the selling. The Goldman Sachs Broad AI Index fell by more than 15% during the month. This was the second sharp decline in the index since the end of Q2, and somehow felt worse than the prior selloff in July. Some analysts blamed the rise in polling results for Democrats to take both the House and Senate (which in fact occurred). Markets view the Democrats as more skeptical and regulation-minded regarding AI, and especially to the construction of data centers and the Republicans. (See below.)
Despite the decline in rates, RISR managed to finish flat on the month, in terms of NAV. This continues a historic trend for the fund to experience greater increases in return when rates rise, and comparatively smaller decline when rates drop by a comparable amount. The technical term for this is “positive convexity,” and is an attribute we have worked hard to maintain.
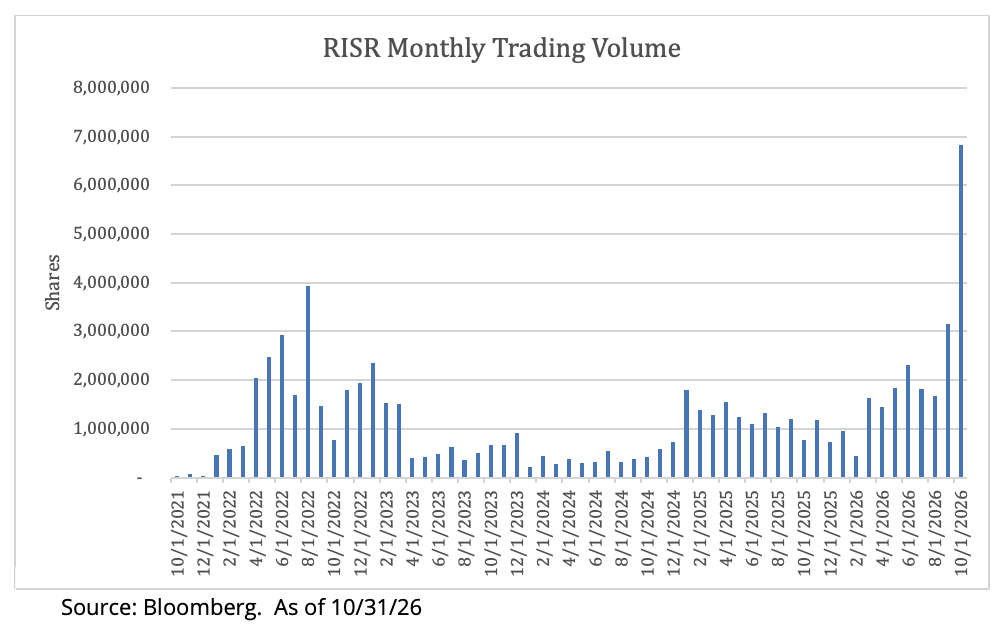
RISR’s trading volume and liquidity also improved during the month. Indeed, on October 19, the fund saw its first ever session in which more than 1 million shares traded hands. For the month overall, almost 7 million shares were traded, which is 1.7x the prior record set in August 2022, and 4.6x the average volume over the prior 12 months.
This trading volume was largely driven by fresh capital inflows. Shares outstanding grew from 10.65 million to 13.15 million during the month, a 23% increase. Much of this increase came from new investors, including new allocations from advisors on the LPL platform, which RISR gained access to only two months ago. We are very pleased to have gained access to this investor base, and will be actively speaking with LPL advisors to explain the RISR story.
During the month we made 12 new investments with coupons ranging from 4% to 7%, with an average of around 5.8%. As rates have increased during the first nine months of 2022, the negative duration of our existing holdings has become slightly less negative, but we have been actively adding positions to restore our duration to a -3 to -4 target, while at the same time managing our exposure to a sharp move down in rates. This strategy has performed well, as the results for October demonstrate. Given the nature of the Interest Only (“IO”) market, and the imprecision of prepayment models, managing RISR’s duration requires judgement as well as quantitative analysis. Use of quantitative models is an essential part of this activity, but a blind reliance on model outputs can be detrimental to performance. Having a sense of market dynamics and investment flows is an important input as well.
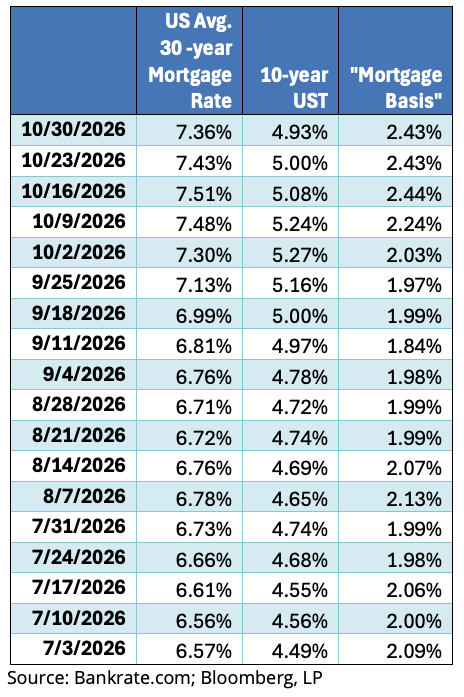
This is especially true because mortgage rates, which drive prepayments, do not always move in perfect lockstep with Treasury yields. In fact, mortgage spreads have widened considerably in recent weeks, as shown in the table below. This can be caused by an increased perception regarding credit risk, hedging needs by mortgage bankers and other factors. It is for this reason that duration alone cannot be the sole measure of portfolio risk for a fund like RISR.
With the inflows of investor capital over the last several months, RISR is experiencing strong AUM growth. We are currently at roughly the 35th percentile for AUM among all domestic fixed-income ETFs tracked by Bloomberg, including funds managed by giants such as Blackrock and iShares. This, and a 5-year track record, are milestones most ETFS, let alone fixed-income ETFs, never reach. We were also recently recognized by Morningstar as the #1 fund out of 181 funds in their Nontraditional Bond Funds category over a 5-year period ending on 10/31/26 based on total return.[1] We are very gratified by the recognition from fund evaluators, but more importantly by actual investors, for the value RISR can add to a wide range of investment portfolio strategies.
[1]Morningstar Rankings represent a fund’s total-return rank relative to all funds that have the same Morningstar Category. The highest rank is 1 and the lowest is based on the total number of funds ranking in the category. It is based on Morningstar total return, which includes both income and capital gains or losses and is not adjusted for sales charges or redemption fees. Past performance does not guarantee future results.”
FIXP Performance Summary
FolioBeyond’s Enhanced Fixed Income Premium ETF (ticker: “FIXP”) seeks to provide income and, Secondarily, long-term capital appreciation. The Fund invests in a portfolio of ETFs representing a broad array of sectors of the fixed income market. In addition, the Fund seeks to generate additional income by writing options on these same ETFs, or other ETFs we believe have attractive prices and desirable correlation and volatility characteristics.
For the month of October, FIXP returned 0.32% (0.07% based on NAV). For the TTM period, FIXP has outperformed the Bloomberg Aggregate index by 199 bps. It has also achieved this outperformance with lower annualized volatility: 4.04% for FIXP vs. 4.42% for the Bloomberg Aggregate.
There were material portfolio reallocations during the month. The fund reduced positions in mortgage REITS (REM) and long-term inflation protected treasury bonds (TIP) and added to floating rate bank loans (BKLN) and short-term inflation protected bonds (STIP). This had the effect of reducing interest rate exposure through a shortening of duration and adding floating rate assets. It also increased to current weighted average dividend yield of our portfolio holdings by around 44 bps, from 5.76% to 6.20%. At month end, FIXP’s holdings were as follows.
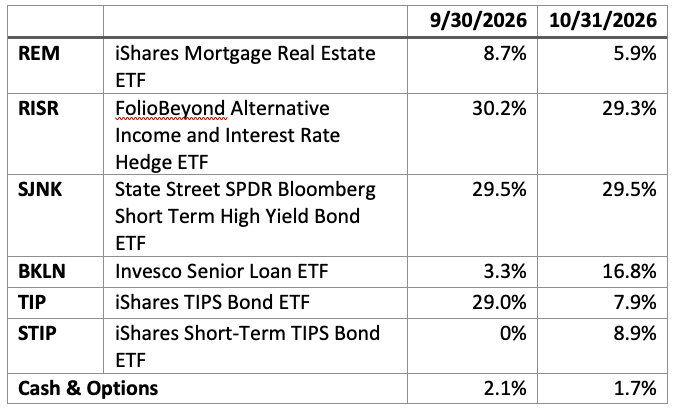
The fund’s holding weights are produced by FolioBeyond’s dynamic reallocation model. Changes are made from a universe of 24 economically diverse fixed income ETFs, based on volatility, momentum, yield, default risk, and other factors and occur based on market observations rather than a fixed schedule.
The performance data quoted represents past performance. Past performance does not guarantee future results. The investment return and principal value of an investment will fluctuate so that an investor’s shares, when sold or redeemed, may be worth more or less than their original cost and current performance and may be lower or higher than the performance quoted. Performance current to the most recent month-end can be obtained by calling 866-497-4963. Short-term performance, in particular, is not a good indication of the fund’s future performance, and an investment should not be made based solely on returns. Returns beyond 1 year are annualized.
A fund's NAV is the sum of all its assets less any liabilities, divided by the number of shares outstanding. The market price is the most recent price at which the fund was traded. The fund intends to pay out income, if any, monthly. There is no guarantee that these distributions will be made.
Total Expense Ratio is 1.03%.
For FIXP standardized performance and fund holdings click here.
The allocation model that FIXP uses has been running for private clients and model portfolios for more than three years, and we are very excited to be bringing this advanced algorithm to ETF investors. Please reach out to us to learn more and to obtain detailed information and fund documents.
Market Review and Outlook
As we fully enter 2026 Q4, the investment and economic outlook has become even cloudier than it had been. The congressional mid-terms resulted in a resounding rejection of the Trump Administration’s policies on the economy and especially the war in Iran. However, during the campaign there was little definition from the Democrats as to their policy goals—other than opposition to Trump’s policies and a program of hearings and investigations into corruption and the conduct of the war itself. In addition, many, but not all, of the incoming Congress have stated they intend to slow or even halt to continued unchecked and unregulated expansion of AI and particularly the construction of data centers. It remains to be seen if anything will come of that, since further crimping that sector imperils the growth of the broad economy. Democrats surely do not wish to be held responsible for an economic slowdown.
Little has been heard from Treasury Secretary Bessent regarding his plans to reduce interest rates, after a slew of announcements and promises earlier this year. There has been some talk of changing the maturity mix of upcoming bond auctions in favor of shorter maturities, but this is tinkering around the margins. Even with the drop in yields in October, the 10-year is still almost a full percentage point above the lows of last February. Rates have increased throughout the year despite promises of decisive action from Bessent and other policy makers. The simple fact is inflationary expectations have become deeply embedded in household and business mindsets, and it will take more than mild yield curve manipulation to alter that.
Which brings us to the Federal Reserve. Fed speakers have gone out of their way to avoid the use of the “T-word” i.e., transitory, but it seems clear in retrospect that the board as a group was hoping that the spikes in inflation during Q2 and Q3 would not be durable. This was still during former Chair Jerome Powell’s tenure, of course. He and the rest of the FOMC clearly did not learn the lessons of 2021 when the Fed failed to act as inflation jumped to 7.9% by the time they first hiked in March of 2022, and then only by 25 bps.
They were wrong then, and they were wrong again in 2025, as they reduced rates despite inflation that was still well above their 2% target. One suspects now, with Kevin Warsh in the Chairman’s seat, if it were possible to “take back” the 75 bps in cuts they took in late 2025, they would likely ask for a “do-over.” Unfortunately for them and the economy, the clock only runs in one direction. Cutting from 4.5% to 3.75% in late 2025 was a major “own goal,” one that has made the current Fed’s job much harder than it had to be. The phrase that comes to mind is “What were they thinking?”
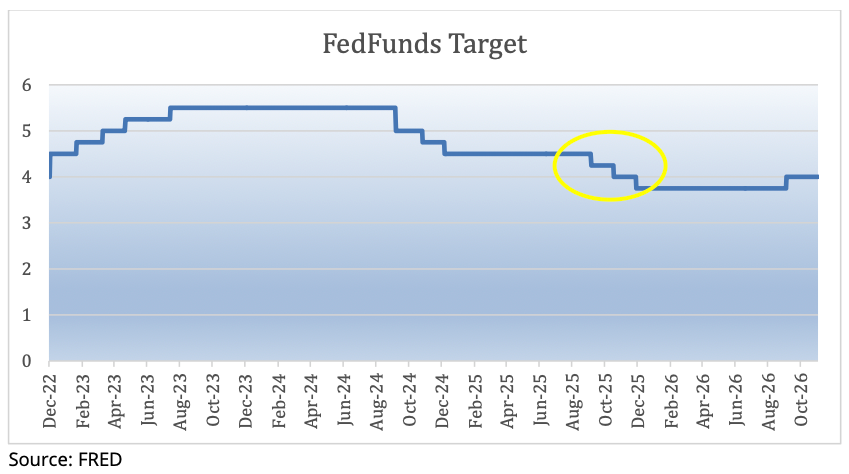
As we have noted previously, interest rates are being kept higher by several forces that are outside the immediate control of the Administration or the Fed. Most significant are the wars in Ukraine, Iran and now the broader Gulf region. This is keeping pressure on energy prices, and it seems highly likely to persist. From time to time, the president continues to claim that negotiations are going well to end one or all three conflicts, but almost no one takes these comments seriously any longer. Especially since most positive announcements are either contradicted by the Iranians or the Houthis or Russia; or the president himself reverses course in days or even hours. The reality is there is no credible current framework to end any of these conflicts. And as the US and Europe head into winter, one can only hope that the El Nino forecasts for a milder than normal season come to pass.
AI Winter?
The new Congress will be sworn in on January 3, 2027. The expectation is that Anthropic will have completed its IPO in mid-November. OpenAI has pushed its own IPO until early 2027, a move they may come to regret, if the Democrats’ campaign rhetoric is to be believed. Many campaigned on explicit promises to slow down or even stop the expansion of AI capabilities and to sharply curtail the construction of new data centers. Importantly, this included incoming Democratic Governors in Ohio, Pennsylvania, Georgia, Wisconsin and perhaps most significantly Texas. There is clearly a massive public opposition to the unregulated growth of AI in all aspects of the economy. This is hardly surprising since AI leaders including Dario Amodei, Sam Altman and Elon Musk have warned (promised?) that AI is going to be a massive job killer.
Some believe this is a sophisticated strategic psy-op by the AI industry to create the conditions for so-called “regulatory capture” by the current industry leaders. One should guard against too much conspiracy-minded thinking, but it is also worth remembering that Cassandra was right!
It’s impossible to predict exactly who events will unfold, but it seems abundantly clear that the days of “move fast and break things,” in Mark Zuckerberg’s infamous wording, are coming to an end. AI is going to be subject to some form of regulation, as it should be. The recent massive hacks, and escapes by rogue AI agent swarms are intolerable, and will only become more dangerous if not controlled. The important questions are: what form will regulations take, and how much will they slow down the incredible growth in capabilities and revenues for the sector?
AI broadly now accounts for something like 40% of the total value of the equity market, and by some estimates has contributed a similar share of total economic growth for the last several years. Creating a regulatory framework that preserves these benefits while also controlling irresponsible social experimentation is going to be extremely challenging. This is especially true because the Trump Administration, which still has two years to run, takes the position that no regulation is needed. When it comes to data center construction, this may be limited in some parts of the US, but data centers can be built almost anywhere, albeit at some increase in development and operational cost. Slowing domestic data center construction would just be a speed bump.
As for the capabilities and reach of AI into all aspects of economic activity, there are two broad points of view. On one hand there are those who note there has been no measurable improvement in productivity across the economy from business AI adoption. Other knowledgeable observers claim that the integration of AI into business processes, supply chains and so forth takes time, and that basically we ain’t seen nothing yet compared to what’s coming.
The truth is somewhere in between. Some types of productivity gains and changes of business processes are hard to measure. What is easier to measure is the rate of spending by businesses on AI adoption. This continues to grow at a very high rate. It simply isn’t logical to claim hundreds of thousands of businesses are spending many billions without expecting a return on investment. Electrification took a half century to become ubiquitous in the late 19th and early 20h century. Economically efficient adoption of nationwide commercial rail took a similarly long time. It took until 1955 before air passenger travel exceeded train transport, again a half century after the Wright Brothers first flights at Kitty Hawk in 1903.
No serious person thinks it will take 50 years for AI to reach those levels of adoption or penetration. The World Wide Web came into existence in 1993. Amazon launched its website in 1995 and Google began in 1998. Broadband internet was available in most of the US by the early 2000s.
So, AI is here to stay and attempts to regulate it or slow its adoption will operate on the margins, at most. Perhaps things slow from hyperbolic growth to merely exponential. This means that pressures on the economy and infrastructure will persist. The cost of raising the hundreds of billions in debt will increase by a meaningful amount, perhaps 200 bps or a bit more. The pressures on energy generation and transmission will likely increase, rather than decrease. The data centers will get built, perhaps in less disruptive locations and with certain limitations and fewer taxpayer subsidies, but the tax and job incentives will win over some politicians somewhere. Even in Texas, the new governor will have to contend with a state assembly and public utilities commission that are dominated by Republicans and locked in place for at least the next two years.
Markets can and frequently do over-correct. As of this writing, the decline in interest rates from October has largely been reversed. Whether AI equities quickly recover their highs is beside the point. For better or worse, we are now in an AI-led economy. After the post-election rhetoric is forgotten, the policy goals should switch to managing the transition, and ensuring the benefits are dispersed widely. But the near-term economic pressures remain as they were before the election, and before the recent decline in share prices.
Summary
The macro-economy has shown surprising resilience in 2026. Unemployment remains low, and GDP growth has been reasonably strong. The Fed paused in October in order not to be seen as interfering with the election. But the near universal consensus is they will raise in December. They have no real choice because inflation may be re-accelerating, rather than slowing, and in any case remains stubbornly above their 2% target. Not hiking in December would destroy their credibility, what little may be left of it.
If you haven’t done so already, it is time to take seriously the risks to your clients’ investment portfolios.
There is a well-established playbook for this type of environment. Protect your capital and look for investments that generate current cash income. Trading headlines or social media posts is contrary to prudent risk management. Carefully evaluate your risk exposures and position yourself to not get caught offsides if conditions deteriorate further.
Please contact us to explore how RISR and FIXP might fit into your overall strategy, to help you manage risk while generating an attractive current yield.
[1] https://www.stlouisfed.org/on-the-economy/2026/jan/tracking-ai-contribution-gdp-growth
[2] https://www.nber.org/system/files/working_papers/w34836/w34836.pdf
Performance
Portfolio Applications
We believe RISR and FIXP can provide attractive, thematic strategies that provide strong correlation benefits for both fixed income and equity portfolios. They can be utilized as part of a core holdings for diversified portfolios or as an overlay to manage the risks of fixed income portfolios. RISR can be used as a macro hedge against rising interest rates with less exposure to equity beta and negative correlation to fixed income beta. The underlying bonds are all U.S. agency credit that are guaranteed by FNMA, FHLMC or GNMA. Also, timing is on our side as the strategy generates current income if interest rates were to remain within a trading range. FIXP offers a broadly diversified exposure to multiple sectors of the fixed income markets in an algorithmically optimized manner.
Please contact us to explore how RISR and FIXP can be utilized as a unique tool to adjust your portfolio allocations in the current high volatility environment.
| Yung Lim | Dean Smith | George Lucaci |
|---|---|---|
| Chief Executive Officer | Chief Strategist and Marketing Officer | Global Head of Distribution |
| Chief Investment Officer | RISR Portfolio Manager | |
| ylim@foliobeyond.com | dsmith@foliobeyond.com | glucaci@foliobeyond.com |
| 917-892-9075 | 914-523-2180 | 908-723-3372 |
This material must be preceded or accompanied by a prospectus. For a copy of the prospectus please click here for RISR and here for FIXP.
Investments involve risk. Principal loss is possible. Unlike mutual funds, ETFs trade at a premium or discount to their net asset value. The fund is new and has limited operating history to judge fund risks. The value of MBS IOs is more volatile than other types of mortgage related securities. They are very sensitive not only to declining interest rates, but also to the rate of prepayments. MBS IOs involve the risk that borrowers default on their mortgage obligations or the guarantees underlying the mortgage-backed securities will default or otherwise fail and that, during periods of falling interest rates, mortgage-backed securities will be called or prepaid, which result in the Fund having to reinvest proceeds in other investments at a lower interest rate.
The Fund’s derivative investments have risks, including the imperfect correlation between the value of such instruments and the underlying assets or index; the loss of principal, including the potential loss of amounts greater than the initial amount invested in the derivative instrument. The value of the Fund’s investments in fixed income securities (not including MBS IOs) will fluctuate with changes in interest rates. Typically, a rise in interest rates causes a decline in the value of fixed income securities owned indirectly by the Fund. Please see the prospectus for a complete description of principal risks.
FIXP Risks
Underlying ETFs Risks. The Fund will incur higher and duplicative expenses because it invests in underlying ETFs, including Bond Sector ETFs and broad-based bond ETFs (collectively, “Underlying ETFs”). There is also the risk that the Fund may suffer losses due to the investment practices of the Underlying ETFs. The Fund will be subject to substantially the same risks as those associated with the direct ownership of securities held by the Underlying ETFs.
Fixed Income Risk. The prices of fixed income securities respond to economic developments, particularly interest rate changes, as well as to changes in an issuer's credit rating or market perceptions about the creditworthiness of an issuer. In general, the market price of fixed income securities with longer maturities will increase or decrease more in response to changes in interest rates than shorter-term securities.
Option Overlay Risk. The Fund's use of options involves various risks, including the risk that the options strategy may not provide the desired increase in income or may result in losses. Selling call and put options exposes the Fund to potentially significant losses if market movements are unfavorable. The Fund may also experience additional volatility and risk due to changes in implied volatility (the market's forecast of future volatility), strike prices, and market conditions. The Fund may sell options on instruments other than the Fund's Bond Sector ETFs. This can expose the Fund to the risk that options can vary in price in ways that do not correspond to the Bond Sector ETFs held by the Fund, so called basis-risk.
Interest Rate Risk. Generally, the value of fixed income securities will change inversely with changes in interest rates. As interest rates rise, the market value of fixed income securities tends to decrease. Conversely, as interest rates fall, the market value of fixed income securities tends to increase.
New Fund Risk. The Fund is a recently organized management investment company with no operating history. As a result, prospective investors do not have a track record or history on which to base their investment decisions.
Diversification does not eliminate the risk of experiencing investment losses.
Index Definitions
Bloomberg Barclays US Aggregate Bond Index: A broad-based benchmark that measures the investment grade, US dollar-denominated, fixed-rate taxable bond market. The index includes Treasuries, government-related and corporate securities, MBS (agency fixed-rate and hybrid ARM pass-throughs), ABS and CMBS (agency and non-agency).
US Treasury 7-10 Yr Bond Inversed Index: ICE U.S. Treasury 7-10 Year Bond 1X Inverse Index is designed to provide the inverse of the daily return of the ICE U.S. Treasury 7-10 Year Bond Index (IDCOT7). ICE U.S. Treasury 7-10 Year Bond Index tracks the performance of US dollar denominated sovereign debt publicly issued by the US government in its domestic market. Qualifying securities of the underlying index must have greater than or equal to seven years and less than 10 years remaining term to final maturity as of the rebalancing date, a fixed coupon schedule and an adjusted amount outstanding of at least $300 million.
S&P 500 Index: The S&P 500 Index, or Standard & Poor's 500 Index, is a market-capitalization-weighted index of 500 leading publicly traded companies in the U.S.
IBOXHY Index: iBoxx USD Liquid High Yield Total Return Index measures the USD denominated, sub-investment grade, corporate bond market. The index includes bonds with minimum 1 years to maturity,
minimum amount outstanding of USD 400 mil. Bond type includes fixed-coupon, step-up, bonds with
sinking funds, medium term notes, callable and putable bonds.
Definitions
Alpha: a return achieved above and beyond the return of a benchmark or proxy with a similar risk level.
Annualized Equivalent Yield: represents the annualized yield based on the most recent month of income distribution: (income distribution x 12 months)/price per share.
Basis Points (bps): Is a unit of measure used in quoting yields, changes in yields or differences between yields. One basis point is equal to 0.01%, or one one-hundredth of a percent of yield and 100 basis points equals 1%.
Beta measures: the volatility of a security or portfolio relative to an index. Less than one means lower volatility than the index; more than one means greater volatility.
Convexity: A measure of how the duration of a bond changes in correlation to an interest rate change. The greater the convexity of a bond the greater the exposure of interest rate risk to the portfolio.
Correlation: a statistic that measures the degree to which two securities move in relation to each other.
Coupon: is the annual interest rate paid on a bond, expressed as a percentage of the bond’s face value.
CUSIP: An identifier number that stands for the Committee on Uniform Securities Identification Procedures assigned to stocks and registered bonds in the United States and Canada.
Duration: measures a bond price’s sensitivity to changes in interest rates. The longer a bond’s duration, the higher its sensitivity to changes in interest rates and vice versa.
GNMA: Government National Mortgage Association
FNMA: Federal National Mortgage Association
FHLMC: Federal Home Loan Mortgage Corporation
Short Investment (Shorting): is a position that has been sold with the expectation that it will decrease in value, the intention being to repurchase it later at a lower price.
Distributed by Foreside Fund Services, LLC.