RISR & FIXP Commentary for October
Click here for a pdf version of this commentary.
RISR Performance Summary
The FolioBeyond Alternative Income and Interest Rate Hedge ETF (ticker: RISR) returned 0.45% based on the closing market price (-0.06% based on net asset value or “NAV”) in October. In comparison, the ICET7IN Index (US Treasury 7-Year Bond Inverse Index) returned ‑0.70% while the Bloomberg Barclays U.S. Aggregate Bond Index ("AGG") returned -0.62% during the same period.
The performance data quoted represents past performance. Past performance does not guarantee future results. The investment return and principal value of an investment will fluctuate so that an investor’s shares, when sold or redeemed, October be worth more or less than their original cost and current performance October be lower or higher than the performance quoted. Performance current to the most recent month-end can be obtained by calling 866-497-4963. Short-term performance, in particular, is not a good indication of the fund’s future performance, and an investment should not be made based solely on returns. Returns beyond 1 year are annualized.
A fund's NAV is the sum of all its assets less any liabilities, divided by the number of shares outstanding. The market price is the most recent price at which the fund was traded. The fund intends to pay out income, if any, monthly. There is no guarantee that these distributions will be made.
Total Expense Ratio is 1.23%.
For standardized performance click here.
RISR produced a positive return in October, despite the fact that the Federal Reserve lowered its target for the Fed Funds rate by 25 bps. Indeed, rates were lower across the yield curve, but short-term rates fell more than long-term rates, i.e. the curve steepened. To be specific, the 10-year Treasury only declined by 7 basis points. A steeper yield curve tends to cause mortgage rates to decline less than they would otherwise. During the month, the average 30-year mortgage rate declined by around 10 bps, to around 6.25%.
Adding to the uncertainty that has dominated market sentiment for some time, the federal government shut down at the beginning of the month and remains closed as of this writing. As a result, the regular flow of economic data that market participants, businesses and households rely on has largely been suspended. Fed Chair Powell alluded to this information blackout in his press conference following the rate cut announcement, but he insisted they are not flying blind. Instead, he pointed to numerous alternative data sources, including the Fed’s own Beige Book, that contain timely information on economic factors. He went on to say, though that as the shutdown extends, the lack of data coming from various departments including Commerce and Labor Departments, will start to adversely affect decision making.
Despite the steady decline in rates since mid-year, there has been relatively little impact on prepayment rates for most of RISR’s holdings. The chart below compares the change in prepayment speeds to the weighted average mortgage rate for each of our MBS positions. The chart shows the difference in Conditional Prepayment Rate[1] (“CPR”) over the most recent 3 months vs the most recent 6 months.

Source: Bloomberg, LP
As expected, the chart shows a positive relationship between mortgage rates and prepayment speeds, with higher mortgage rates seeing faster prepayment speeds in response to the decline in market rates. However, the impact so far has been very mild, and many of our positions have actually seen slower speeds recently. This speaks to the fact that there are several other factors besides interest rates that are inhibiting mortgage prepayments, including most especially high housing prices.[2] We expect these factors, as well as a steeper yield curve to keep prepayment speeds depressed for some time, which benefits RISR.
Since its inception in 2021, RISR has tracked interest rates and the broad bond market, almost exactly as designed. The graph below shows the positive relationship between RISR and the yield on the 10-year Treasury bond (white line), as well as the inverse relationship between RISR (blue line) and the broad bond market as represented by Bloomberg US Aggregate Bond Index (LBUSTRUU, orange line).

Source: Bloomberg: LP
As the chart shows, RISR’ price has increased as the 10-year yield has increased from 1.5% in 2021, to roughly 4.1% currently. It is also notable that as interest rates have fallen from the recent high of 4.75%, RISR has been fairly stable, declining less than 3%, from around 37 to 36 over the same period of time. In addition, the strong inverse relationship between RISR and the broad bond market has held very well, demonstrating the value of RISR as a hedge and diversifier for a broad range of fixed income portfolios. Since inception, the correlation between RISR and the aggregate index has been approximately -0.5.
The reduction in yields and spreads is at pace with recent trends across a variety of markets that reflect a relaxed attitude toward certain risks by many investors. This can be seen in ever-rising stock prices as well as the very low spreads between investment grade and below investment grade debt. We believe this attitude is misplaced, as we will discuss further below in the outlook.
FIXP Performance Summary
FolioBeyond’s Enhanced Fixed Income Premium ETF (ticker: “FIXP”) seeks to provide income and, secondarily, long-term capital appreciation. The Fund invests in a portfolio of ETFs representing certain sectors of the fixed income market. In addition, the Fund seeks to generate additional income by writing options on these same ETFs, or other ETFs we believe have attractive prices and desirable correlation and volatility characteristics.
For the month of October, FIXP returned 0.53% (0.66% based on NAV), to bring the YTD return to 2.84%. There were no portfolio reallocations during the month, but weightings changed slightly due to differential performance.
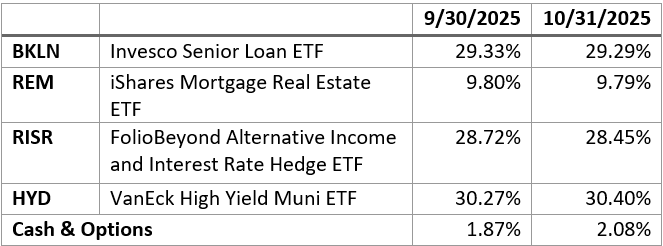
The fund’s holding weights are produced by FolioBeyond’s dynamic reallocation model. Changes are made from a universe of 24 economically diverse fixed income ETFs, based on volatility, momentum, yield, default risk, and other factors and occur based on market observations rather than a fixed schedule. For the last handful of reallocations most of the changes have been between REM and SJNK. This is not surprising given the volatile and shifting environment for real estate assets (REM), on the one hand, vs. high-yield corporates (SJNK), on the other.
The performance data quoted represents past performance. Past performance does not guarantee future results. The investment return and principal value of an investment will fluctuate so that an investor’s shares, when sold or redeemed, October be worth more or less than their original cost and current performance and October be lower or higher than the performance quoted. Performance current to the most recent month-end can be obtained by calling 866-497-4963. Short-term performance, in particular, is not a good indication of the fund’s future performance, and an investment should not be made based solely on returns. Returns beyond 1 year are annualized.
A fund's NAV is the sum of all its assets less any liabilities, divided by the number of shares outstanding. The market price is the most recent price at which the fund was traded. The fund intends to pay out income, if any, monthly. There is no guarantee that these distributions will be made.
Total Expense Ratio is 1.07%.
For FIXP standardized performance and fund holdings click here.
FIXP’s option holdings contributed minimally to October’s total return, due to low implied volatility in the slightly out of the money options we wrote against our underlying holdings. We continue to explore ways to enhance option premium income despite low premiums generally being paid for such options in the current environment.
The allocation model that FIXP uses has been running for private clients and model portfolios for more than three years, and we are very excited to be bringing this advanced algorithm to ETF investors. Please reach out to us to learn more and to obtain detailed information and fund documents.
Market Outlook
October was book-ended by two significant policy outcomes. On October 1, the federal government shut down all non-essential functions, and it remained closed for the entire month. On October 31, the Federal Reserve cut its target Fed Funds rate by 25 bps to 4%, the second cut in as many months, following a 9-month period with no rate actions. Both events were expected, but the rate cut had little impact. This was not the case for the shutdown, which had immediate and adverse effects on the economy almost immediately.
Although widely anticipated, the shutdown was essentially pointless, and resulted from an effort by Democrats to restore certain spending priorities that had been eliminated in the One Big Beautiful Bill passed earlier in the year. The most significant demand was for restoration of subsidies for ACA healthcare premiums that were set to sunset by year end. For 30 days each side accused the other of stonewalling and not acting in good faith. Meanwhile, the market—and the Federal Reserve—were forced to act without timely information on the state of labor markets, economic growth and inflation. As the weeks passed, certain federal employees were required to work without pay, including active-duty military and the TSA and air traffic controllers who keep our airspace running. Meanwhile more than 2 million federal employees were sent home, with several thousand being laid off permanently. As October wound down, stresses in air traffic were being felt in both passenger and air freight markets.
As of this writing, it seems a vote to re-open the government is at hand, with none of the Democrats’ stated goals for the shutdown having been achieved. Republicans have promised to hold votes at some future date on those demands, but that was the deal on offer at the start of the month. Whether one agrees with the goals of restoring expiring certain health insurance subsidies or not, it is clear this disruptive shutdown did not meaningfully alter the terms of debate on the issue. Instead, the shutdown was almost a pure economic deadweight loss in output and prosperity.
Meanwhile of course, the stock market continued to climb, reaching new all-time highs during the month. Most of the stock market action continues to be driven by the performance of a small number of technology/AI related stocks. This has stimulated a growing discussion about whether there is an “AI-bubble” forming. There are solid arguments on both sides of the question. The “yes” side can point to several factors including traditional market measure such as stretched PE ratios, as well as the seemingly circular rounds of inter-company investment and purchase agreements among the largest players. In certain of the deals announced, company A has agreed to make a massive investment in company B, in exchange for company B agreeing to purchase foods and services from company A for a similar amount. In addition, the forecasts for energy generation and data center construction that will be required to meet the growth goals for the sector are truly astonishing, totaling trillions of dollars.
The “no” side argues that AI is a transformational technology development, that is set to alter virtually all parts of the economy, producing economic output gains that haven’t been seen since the industrial revolution, if ever. At the same time, it has the potential to eliminate tens of millions of jobs, but somehow, that will be addressed through a new global system of transfer payments to those adversely affected. There are few specifics on offer about how that would work, but many leaders in the space fully endorse that eventuality.
Two things can be true at the same time: 1) AI is a unique and unprecedented technology that has the potential to transform human society; and 2) The prices for AI-related shares and the amount of investment in the sector is unsustainable and a correction, or worse, is overdue. As of today, the so-called Magnificent Seven technology companies, represent more than 1/3 of the total US stock market capitalization. That is a concentration of value without precedent in modern times. Even ordinary investors who do not have a specific focus or belief in AI are exposed to the sector through diversified mutual fund and ETF holdings. Indeed, it would be challenging to create an equity strategy with no exposure to the sector. Even if one did not hold any of these shares, a bursting of a bubble, would have cascading effects across markets and the economy. It is for this reason, forward thinking observers are wondering out loud if we are heading into another too big to fail situation, but this time with tech rather than banks. And then there is the viewpoint that we need to pause and take stock of where this is all headed before we inadvertently build an AI doomsday machine. The debate between the “accelerationists” and the “doomers” seems bound to get more heated.
In other words, there is almost nowhere to hide. The US finds itself in an AI arms race with China that many believe it must win. As a result, a massive bet is being made. If it pays off, there is at least the possibility of a new era of prosperity and economic growth. If it does not, or if there are technological challenges, or socio-political resistance to the upheavals contemplated by the tech leaders, the economic fallout could be extreme.
Compared to this debate, arguments over the Federal Reserve’s policy decisions almost seem quaint. At his month-end press conference following the 25 bps cut, Fed Chair Powell insisted that the Fed has sufficient visibility into labor and financial market conditions, and that any additional rate cuts should not be taken as a foregone conclusion. Recall that the cut in September was instigated by a perceived softening of the labor market, despite inflation being well above the Fed’s stated 2% target. Moreover, there was widespread disagreement among the FOMC regarding the most recent cut. Some voting members wanted no cut, while at least one member argued for a 50 bp cut.
In our view the Fed should not cut rates further. Inflation has reaccelerated and has increased every month since April. The labor market, while softer, is still strong enough to hold the unemployment rate to around 4.3%. But with the massive movements of undocumented workers out of the US, disruptions from AI, declines in government hiring across the country, and other special factors, it is unlikely that further modest cuts will restore job growth, and has the very real risk of further increasing inflationary pressures. And of course, the tariffs remain in force, and are likely to be removed, no matter how the Supreme Court rules on the IEEPA case now before it. The Trump Administration believes they have ample alternative authorities for broad based tariffs. If they lose here, they will pivot to Plan B, and then Plan C, and so on. This will keep the courts tied up for years, while high tariffs remain in place indefinitely.
In light of all this, we think we have seen the lows in interest rates for this cycle, and we expect further curve steepening, and even outright increases in rates from 10-years maturities through 30-year long bon rates. In that case, mortgage rates will remain elevated. Of the range of possible economic environments over the next several years, we continue to place a high probability on stagflation.
There is a prudent, well-established playbook for this type of environment. Protect your capital and look for investments that generate current cash income. Trying to trade the news or time the markets in such an environment is reckless in the extreme. The news will always be faster and more unpredictable that you are as an investor.
Please contact us to explore how RISR and FIXP might fit into your overall strategy, to help you manage risk while generating an attractive current yield.

[1] Conditional Prepayment Rate or CPR, is the annualized rate of prepayments in the underlying mortgage pool, expressed as a percentage of the aggregate loan balance as of the beginning of each month. For example, 6 CPR mean that approximately 0.5% (6/12) of the pool prepaid in a given month.
[2] The chart excludes a handful of positions with loan counts below 250, as those pools can be highly volatile depending on the prepayment of a small number of loans.
Portfolio Applications
We believe RISR and FIXP can provide attractive, thematic strategies that provide strong correlation benefits for both fixed income and equity portfolios. They can be utilized as part of a core holdings for diversified portfolios or as an overlay to manage the risks of fixed income portfolios. RISR can be used as a macro hedge against rising interest rates with less exposure to equity beta and negative correlation to fixed income beta. The underlying bonds are all U.S. agency credit that are guaranteed by FNMA, FHLMC or GNMA. Also, timing is on our side as the strategy generates current income if interest rates were to remain within a trading range. FIXP offers a broadly diversified exposure to multiple sectors of the fixed income markets in an algorithmically optimized manner.
Please contact us to explore how RISR and FIXP can be utilized as a unique tool to adjust your portfolio allocations in the current high volatility environment.
| Yung Lim | Dean Smith | George Lucaci |
|---|---|---|
| Chief Executive Officer | Chief Strategist and Marketing Officer | Global Head of Distribution |
| Chief Investment Officer | RISR Portfolio Manager | |
| ylim@foliobeyond.com | dsmith@foliobeyond.com | glucaci@foliobeyond.com |
| 917-892-9075 | 914-523-2180 | 908-723-3372 |
This material must be preceded or accompanied by a prospectus. For a copy of the prospectus please click here for RISR and here for FIXP.
Investments involve risk. Principal loss is possible. Unlike mutual funds, ETFs trade at a premium or discount to their net asset value. The fund is new and has limited operating history to judge fund risks. The value of MBS IOs is more volatile than other types of mortgage related securities. They are very sensitive not only to declining interest rates, but also to the rate of prepayments. MBS IOs involve the risk that borrowers default on their mortgage obligations or the guarantees underlying the mortgage-backed securities will default or otherwise fail and that, during periods of falling interest rates, mortgage-backed securities will be called or prepaid, which result in the Fund having to reinvest proceeds in other investments at a lower interest rate.
The Fund’s derivative investments have risks, including the imperfect correlation between the value of such instruments and the underlying assets or index; the loss of principal, including the potential loss of amounts greater than the initial amount invested in the derivative instrument. The value of the Fund’s investments in fixed income securities (not including MBS IOs) will fluctuate with changes in interest rates. Typically, a rise in interest rates causes a decline in the value of fixed income securities owned indirectly by the Fund. Please see the prospectus for a complete description of principal risks.
The Morningstar Rating™ for funds, or "star rating," is calculated for managed products (including mutual funds, variable annuity and variable life subaccounts, exchange-traded funds, closed-end funds and separate accounts) with at least a three-year history without adjustment for sales load. Exchange-traded funds and open-ended mutual funds are considered a single population for comparative purposes. It is calculated based on a Morningstar Risk- Adjusted Return measure that accounts for variation in a managed product's monthly excess performance, placing more emphasis on downward variations and rewarding consistent performance. The top 10% of products in each product category receive five stars, the next 22.5% receive four stars, the next 35% receive three stars, the next 22.5% receive two stars, and the bottom 10% receive one star. The Overall Morningstar Rating™ for a managed product is derived from a weighted average of the performance figures associated with its three-, five- and 10-year (if applicable) Morningstar Rating™ metrics. The weights are: 100% three-year rating for 36 - 59 months of total returns, 60% five-year rating/40% three-year rating for 60 - 119 months of total returns, and 50% 10-year rating/30% five-year rating/20% three-year rating for 120 or more months of total returns. While the 10-year overall star rating formula seems to give the most weight to the 10-year period, the most recent three-year period actually has the greatest impact because it is included in all three rating periods. As of 9/30/2024, RISR was rated against the following number of Nontraditional Bond Funds over the following periods: 272 for the 3-year time period. RISR received 5 stars for those periods. Ratings for other share classes October differ. Past performance is no guarantee of future results.
FIXP Risks
Underlying ETFs Risks. The Fund will incur higher and duplicative expenses because it invests in underlying ETFs, including Bond Sector ETFs and broad-based bond ETFs (collectively, “Underlying ETFs”). There is also the risk that the Fund may suffer losses due to the investment practices of the Underlying ETFs. The Fund will be subject to substantially the same risks as those associated with the direct ownership of securities held by the Underlying ETFs.
Fixed Income Risk. The prices of fixed income securities respond to economic developments, particularly interest rate changes, as well as to changes in an issuer's credit rating or market perceptions about the creditworthiness of an issuer. In general, the market price of fixed income securities with longer maturities will increase or decrease more in response to changes in interest rates than shorter-term securities.
Option Overlay Risk. The Fund's use of options involves various risks, including the risk that the options strategy may not provide the desired increase in income or may result in losses. Selling call and put options exposes the Fund to potentially significant losses if market movements are unfavorable. The Fund may also experience additional volatility and risk due to changes in implied volatility (the market's forecast of future volatility), strike prices, and market conditions. The Fund may sell options on instruments other than the Fund's Bond Sector ETFs. This can expose the Fund to the risk that options can vary in price in ways that do not correspond to the Bond Sector ETFs held by the Fund, so called basis-risk.
Interest Rate Risk. Generally, the value of fixed income securities will change inversely with changes in interest rates. As interest rates rise, the market value of fixed income securities tends to decrease. Conversely, as interest rates fall, the market value of fixed income securities tends to increase.
New Fund Risk. The Fund is a recently organized management investment company with no operating history. As a result, prospective investors do not have a track record or history on which to base their investment decisions.
Diversification does not eliminate the risk of experiencing investment losses.
Index Definitions
Bloomberg Barclays US Aggregate Bond Index: A broad-based benchmark that measures the investment grade, US dollar-denominated, fixed-rate taxable bond market. The index includes Treasuries, government-related and corporate securities, MBS (agency fixed-rate and hybrid ARM pass-throughs), ABS and CMBS (agency and non-agency).
US Treasury 7-10 Yr Bond Inversed Index: ICE U.S. Treasury 7-10 Year Bond 1X Inverse Index is designed to provide the inverse of the daily return of the ICE U.S. Treasury 7-10 Year Bond Index (IDCOT7). ICE U.S. Treasury 7-10 Year Bond Index tracks the performance of US dollar denominated sovereign debt publicly issued by the US government in its domestic market. Qualifying securities of the underlying index must have greater than or equal to seven years and less than 10 years remaining term to final maturity as of the rebalancing date, a fixed coupon schedule and an adjusted amount outstanding of at least $300 million.
S&P 500 Index: The S&P 500 Index, or Standard & Poor's 500 Index, is a market-capitalization-weighted index of 500 leading publicly traded companies in the U.S.
IBOXHY Index: iBoxx USD Liquid High Yield Total Return Index measures the USD denominated, sub-investment grade, corporate bond market. The index includes bonds with minimum 1 years to maturity,
minimum amount outstanding of USD 400 mil. Bond type includes fixed-coupon, step-up, bonds with
sinking funds, medium term notes, callable and putable bonds.
Definitions
Alpha: a return achieved above and beyond the return of a benchmark or proxy with a similar risk level.
Annualized Equivalent Yield: represents the annualized yield based on the most recent month of income distribution: (income distribution x 12 months)/price per share.
Basis Points (bps): Is a unit of measure used in quoting yields, changes in yields or differences between yields. One basis point is equal to 0.01%, or one one-hundredth of a percent of yield and 100 basis points equals 1%.
Beta measures: the volatility of a security or portfolio relative to an index. Less than one means lower volatility than the index; more than one means greater volatility.
Convexity: A measure of how the duration of a bond changes in correlation to an interest rate change. The greater the convexity of a bond the greater the exposure of interest rate risk to the portfolio.
Correlation: a statistic that measures the degree to which two securities move in relation to each other.
Coupon: is the annual interest rate paid on a bond, expressed as a percentage of the bond’s face value.
CUSIP: An identifier number that stands for the Committee on Uniform Securities Identification Procedures assigned to stocks and registered bonds in the United States and Canada.
Duration: measures a bond price’s sensitivity to changes in interest rates. The longer a bond’s duration, the higher its sensitivity to changes in interest rates and vice versa.
GNMA: Government National Mortgage Association
FNMA: Federal National Mortgage Association
FHLMC: Federal Home Loan Mortgage Corporation
Short Investment (Shorting): is a position that has been sold with the expectation that it will decrease in value, the intention being to repurchase it later at a lower price.
Distributed by Foreside Fund Services, LLC.