RISR & FIXP Commentary for November
Click here for a pdf version of this commentary.
RISR Performance Summary
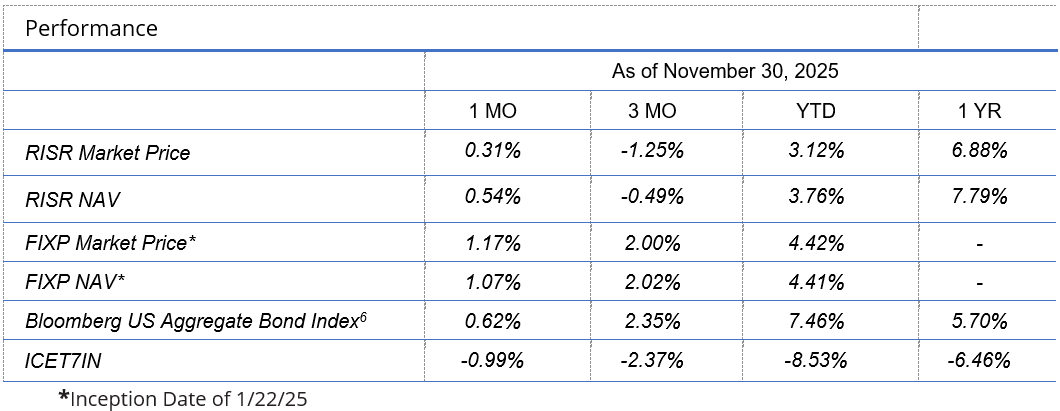
The FolioBeyond Alternative Income and Interest Rate Hedge ETF (ticker: RISR) returned 0.31% based on the closing market price (0.54% based on net asset value or “NAV”) in November. In comparison, the ICET7IN Index (US Treasury 7-Year Bond Inverse Index) returned -0.99% while the Bloomberg Barclays U.S. Aggregate Bond Index ("AGG") returned 0.621% during the same period.
The performance data quoted represents past performance. Past performance does not guarantee future results. The investment return and principal value of an investment will fluctuate so that an investor’s shares, when sold or redeemed, November be worth more or less than their original cost and current performance November be lower or higher than the performance quoted. Performance current to the most recent month-end can be obtained by calling 866-497-4963. Short-term performance, in particular, is not a good indication of the fund’s future performance, and an investment should not be made based solely on returns. Returns beyond 1 year are annualized.
A fund's NAV is the sum of all its assets less any liabilities, divided by the number of shares outstanding. The market price is the most recent price at which the fund was traded. The fund intends to pay out income, if any, monthly. There is no guarantee that these distributions will be made.
Total Expense Ratio is 1.04%.
For standardized performance click here.
RISR produced a positive return in November despite a declining interest rate environment for most of the month. While the market waited for the government to reopen, as it did on November 12 after a 43-day shutdown, rates generally drifted lower for most of the month, declining by 10-12 basis points across the curve. This left the important 2s/10s spread at 52 bps, basically unchanged from October. The directionless market was due in part to the lack of economic data on prices, jobs and other measures of economic activity. Numerous reports that were delayed during the shutdown were later announced as permanently cancelled. Data that would have been gathered in October and released in November simply was not collected at all and could not be effectively reconstructed. This meant that not only was the Fed flying blind, so were investors.
It is safe to say that the extended shutdown did not achieve anything meaningful for either Democrats or Republicans. The primary sticking point—Obamacare premium subsidies—were in limbo before the shutdown and remained that way when the shutdown ended. Meanwhile passenger and freight air traffic had to be reduced, and other short-term austerity measures were implemented. It will be interesting to see whether and how much this affected overall economic activity in Q4, but so far the impacts seem small.
During the shutdown, the political debate swung sharply in the direction of “affordability,” specifically housing affordability. This was triggered by a viral substack article that claimed because of inflation, the new poverty line should be drawn at a household income of $140,000 per year for a family of four.[1] A vigorous public debate followed that publication, with arguments both in favor and against such a high number. The Wall Street Journal also published a widely commented upon article with the headline: “The Middle Class is Buckling Under Almost Five Years of Persistent Inflation.”[2] The Trump Administration entered the conversation with a few unworkable, or even counter-productive, policy proposals including 50-year mortgages and transferable mortgages.
But for markets and RISR the significance was how these discussions affected mortgage rates. The answer to that is not at all. Indeed, despite a general decline in treasury yields, 30-year mortgage rate actually increased a bit during the month, to close at 6.36%.[3] This helped RISR’s performance for the month, as higher mortgage rates correlate to slower prepayments.
This is especially true because RISR’s portfolio is almost entirely allocated to mortgages with interest rates well below current levels, as seen in the table below. It would require a significant decline in mortgage rates to induce a material increase in prepayment speeds for our holdings.
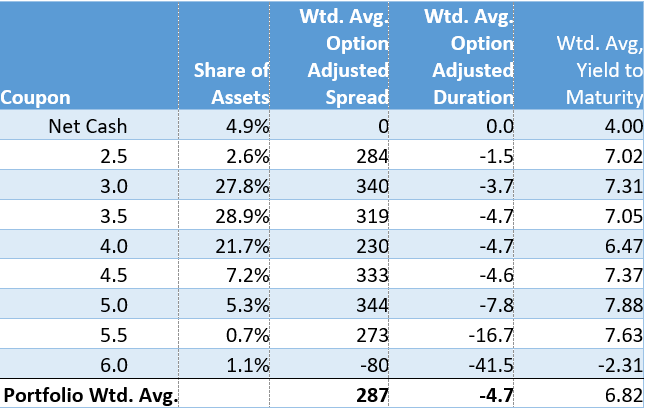
Since its inception in 2021, RISR has tracked interest rates and the broad bond market, almost exactly as designed. During periods where interest rates have increased, RISR has tended to increase in value. But even during periods of falling rates, RISR has held its value, and produced positive returns from interest income. While mortgage rates have come down by more than 100 bps so far in 2025, RISR’s YTD total return has been positive 3.12%.
RISR Share Price vs 30-year Mortgage Rate
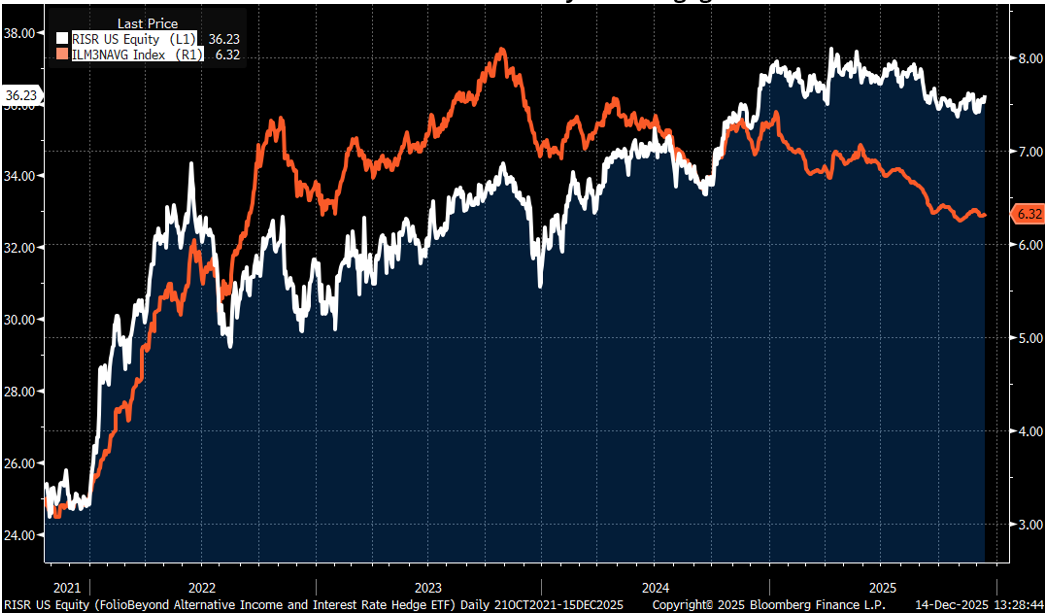
As the chart shows, RISR’s share price increased from $25.00 at launch to $34.34 by the time rates peaked in mid-2023. Since then, as mortgage rates have traded in a range between around 6.3% and 7%, RISR’s share price has continued to drift higher, and has been remarkably stable since late 2024, despite the drop in mortgage rates. This clearly demonstrates how RISR has worked to offset the effects of rising rate on fixed income broadly, while maintaining value and producing positive total return even when rates moderate.
FIXP Performance Summary
FolioBeyond’s Enhanced Fixed Income Premium ETF (ticker: “FIXP”) seeks to provide income and, secondarily, long-term capital appreciation. The Fund invests in a portfolio of ETFs representing certain sectors of the fixed income market. In addition, the Fund seeks to generate additional income by writing options on these same ETFs, or other ETFs we believe have attractive prices and desirable correlation and volatility characteristics.
For the month of November, FIXP returned 1.17% (1.07% based on NAV), to bring the YTD return to 4.42%. There were no portfolio reallocations during the month, but weightings changed slightly due to differential performance.
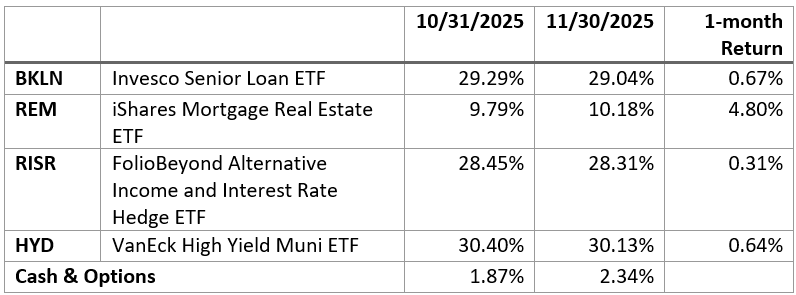
As the table shows, FIXP’s performance was driven principally by a strong outperformance of REM, a mortgage REIT ETF. This was largely driven by the growing expectations for further rates cuts by the Fed. Since REITs generally use leverage, a lower cost of funding has a positive impact on their net interest margin. And, as noted above, a generally lower yield curve tends to increase the value of REIT mortgage loan and MBS holdings. It is worth noting that our allocation model had cut our REM allocation to zero over the summer, and added it back in late September, in time to take advantage of the evolving rate environment.
In addition, the Fund’s option overlay contributed to the strong monthly performance in November.
The fund’s holding weights are produced by FolioBeyond’s dynamic reallocation model. Changes are made from a universe of 24 economically diverse fixed income ETFs, based on volatility, momentum, yield, default risk, and other factors and occur based on market observations rather than a fixed schedule. For the last handful of reallocations most of the changes have been between REM and SJNK. This is not surprising given the volatile and shifting environment for real estate assets (REM), on the one hand, vs. high-yield corporates (SJNK), on the other.
The performance data quoted represents past performance. Past performance does not guarantee future results. The investment return and principal value of an investment will fluctuate so that an investor’s shares, when sold or redeemed, November be worth more or less than their original cost and current performance and November be lower or higher than the performance quoted. Performance current to the most recent month-end can be obtained by calling 866-497-4963. Short-term performance, in particular, is not a good indication of the fund’s future performance, and an investment should not be made based solely on returns. Returns beyond 1 year are annualized.
A fund's NAV is the sum of all its assets less any liabilities, divided by the number of shares outstanding. The market price is the most recent price at which the fund was traded. The fund intends to pay out income, if any, monthly. There is no guarantee that these distributions will be made.
Total Expense Ratio is 1.01%.
For FIXP standardized performance and fund holdings click here.
The allocation model that FIXP uses has been running for private clients and model portfolios for more than three years, and we are very excited to be bringing this advanced algorithm to ETF investors. Please reach out to us to learn more and to obtain detailed information and fund documents.
Market Outlook
Three broad themes have dominated the discourse around the economy and financial markets this year: Federal Reserve policy, tariffs and the AI boom/bubble. It seems likely this focus will extend into 2026. Let’s turn first to Fed policy.
Federal Reserve Policy
When the Fed last cut on October 29, Chair Jay Powell in his press conference emphasized that the economic picture was particularly unclear, and made even more obscure by the government shutdown. He further went out of his way to state multiple times that future rate cuts were not a certainty. Initially this had the effect of pushing rates up immediately following Powell’s statements. Just few weeks later as numbers indicating continued labor market softening this selloff was nearly fully reversed as “Fed will cut” bets came back to the fore.
10-Year Treasury Yield
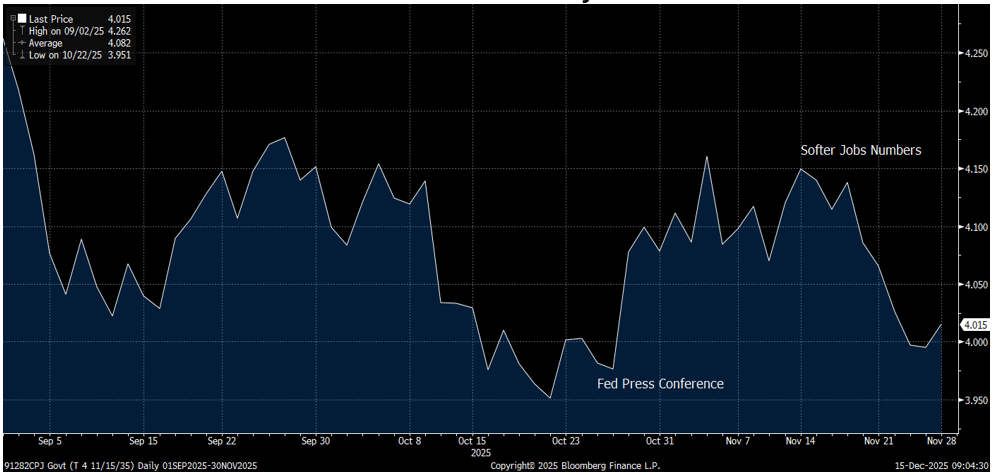
This “will they/won’t they” dynamic seems likely to be with us for some time. Despite inflation running materially above the Fed’s stated 2% target, and despite a low unemployment rate and other mixed signals coming from labor market, pressure on the Fed from the Trump Administration shows no sign of relenting.
The picture is further complicated because of dissent within the FOMC, and the pending replacement of Powell as Fed Chair in Q2. At the October meeting, there were dissents from the 25 bp cut decision on both ends of the spectrum. Temporary Fed member Miran, on leave from the president’s Council of Economic Advisors, proposed a larger 50 bp cut, while two more hawkish members voted for no cut. Such a voting pattern is not unprecedented, but quite unusual. The Fed Chair tends to get his or her way, most of the time.
This Fed Chair is already being perceived as a lame duck, however. President Trump, Treasury Secretary Bessent and other members of the administration have been quite vocal in criticizing Powell, and have made it abundantly clear his replacement will be expected to steer a much more dovish path. Powell, to his credit, has declined to engage in the public debate. The president has indicated he may name a nominee well before Powell’s term ends in May. This raises the prospect for a lame duck Chair contending with a shadow Chair potentially weighing in as a way to sway other FOMC members, before actually taking office.
These political dynamics further complicate an already murky economic picture. Consequently each of the upcoming meetings until Powell is replaced, in January, March and April, will be intensively watched, discussed and speculated over. Barring some economic event that drives policy definitely in one direction or the other (see, AI bubble, below), this means the short end will continue to churn, while the long end continues to steepen in sympathy with growing inflationary concerns.
However, even appointing a new Fed Chair more to the president’s liking won’t resolve matters. The extremely dovish Miran is a temporary member, and will be replaced in Q1. Moreover, more hawkish members have increasingly been willing to publicly defy Powell, and would likely be even more outspoken in opposition to a new Chair thought to be a cat’s paw of the president. The Fed’s independence and credibility will be tested in 2026 in a way it hasn’t been for some time. Perhaps not since Nixon’s appointment of Arthur Burns in 1970. For those not familiar with how that played out, by 1974 inflation had hit 12%, on its way to 15% by 1980.
Tariffs
The next shoe to drop on the long-running tariff drama is a decision on the legality of the tariffs imposed in April under the International Emergency Economic Powers Act (IEEPA). The Supreme Court heard arguments on the matter in November, and based on the questions posed in that hearing, it is impossible to predict which way they will decide. Federal Courts have historically given presidents great latitude to conduct foreign policy, and the administration argues that should continue to be the case here. On the other side, plaintiffs argue the plain language of the statute excludes the type of broad, indeterminate duration tariffs that are now in place. Further complicating the decision is what should happen to the tariffs already collected if SCOTUS rules against the administration. The money, amounting to hundreds of billions of dollars, has already been spent and it would be exceedingly difficult to find the cash to refund them, or even to identify to whom refunds would be due. Litigating that would likely take years, and hundreds of thousands of parties would have to press their claims.
While the court could rule in early 2026, the administration credibly claims to have numerous other legal authorities under which it could reinstate tariffs if IEEPA authority is blocked. So even a loss at the Supreme Court does not mean broad-based tariffs would go away. This chaotic situation is going to be with us most likely through the end of President Trump’s term in 2028, at least.
AI Boom/Bubble
In recent weeks, a number of influential voices have publicly expressed concerns about the magnitude of capital expenditure announced or anticipated to build out the data center and energy generation capacity to support AI development. Depending on who is speaking, something like $5-7 trillion in spending is foreseen by 2030. The companies involved will not generate revenues anywhere near that number, so the build-out will have to be financed through additional equity offerings, and a large issuance of debt. People including Microsoft CEO Satya Nadell, JP Morgan CEO Jamie Dimon and “Big Short” investor Michael Burry have publicly questioned the return on investment available in this sector. Another trend skeptics find troubling are the so-called circular investment deals, where company A announces a massive purchase of products or services from company B, that is only made possible by an investment or loan to from company B to company A.
In response to this growing concern, equity prices from the major public AI-related stocks have seen pullbacks, including NVIDIA, AMD, Google, Oracle. Until recently, it was all “up and to the right” for this sector.
Tech Stock Pullback
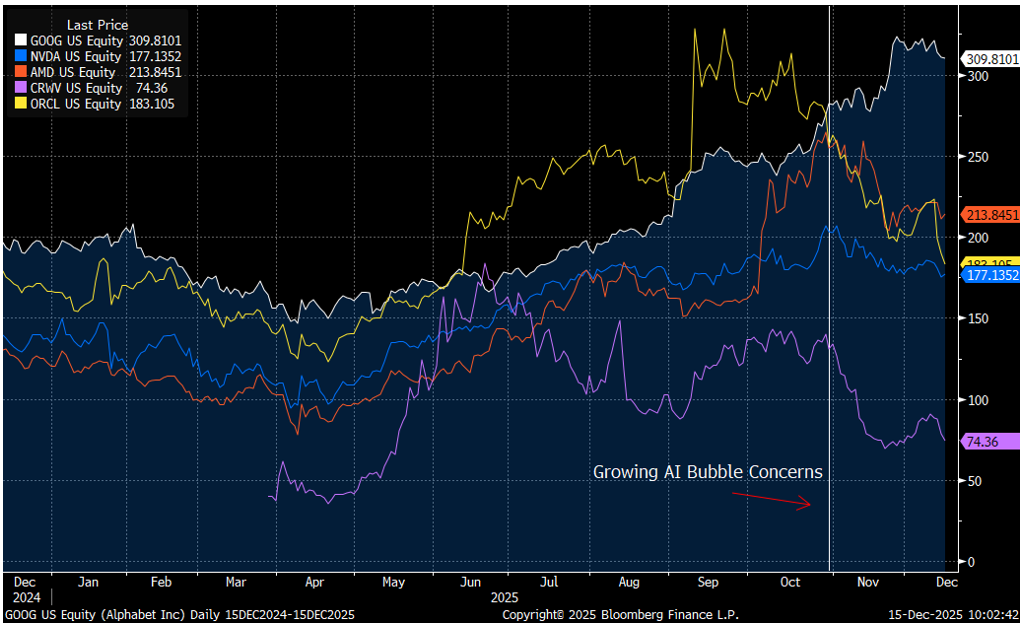
Despite growing concerns, and recent stock price declines, the AI-related sector dominates equity market valuations, and the so-called Magnificent 7 stocks still constitute more than 1/3 of total domestic stock market capitalization. These means that any sustained, large, broad-based decline—a popping of the bubble—could have extremely adverse implications for the broader economy.
As we observed last month, one can believe both: 1) AI is a unique and unprecedented technology that has the potential to transform human society; and 2) The prices for AI-related shares and the amount of investment in the sector is unsustainable and a correction, or worse, is overdue. We don’t have a crystal ball that can predict whether, when or how such a correction might occur, or how widespread its effect might be.
But we firmly believe the current projected growth goals for AI spending, revenues and profits are unlikely to be met and will have to be significantly reduced and rationalized. We have seen such technological innovations before. From electrification, to railroads to the internet itself, booms beget lots of business formation and speculation, and there is inevitably a culling period where firms fail or are acquired and expectations for growth and investment are brought to earth. We may be in the early stages of that process now, or a new rally could emerge. But equity and debt markets are strongly suggesting 2026 could see “a” correction, even if it isn’t “the” correction.
In light of all this, we think we have seen the lows in interest rates for this cycle, and we expect further curve steepening, and even outright increases in rates from 10-years maturities through 30-year long bond rates. In that case, mortgage rates will remain elevated. Of the range of possible economic environments over the next several years, we continue to place a high probability on stagflation.
There is a prudent, well-established playbook for this type of environment. Protect your capital and look for investments that generate current cash income. Trying to trade the news or time the markets in such an environment is reckless in the extreme. The news will always be faster and more unpredictable that you are as an investor.
Please contact us to explore how RISR and FIXP might fit into your overall strategy, to help you manage risk while generating an attractive current yield.
[1] Michael W. Green, “Part 1: My Life Is a Lie: How a Broken Benchmark Quietly Broke America” November 23, 2025
[2] Wall Street Journal November 21, 2025.
[3] BankRate.com national average.
Portfolio Applications
We believe RISR and FIXP can provide attractive, thematic strategies that provide strong correlation benefits for both fixed income and equity portfolios. They can be utilized as part of a core holdings for diversified portfolios or as an overlay to manage the risks of fixed income portfolios. RISR can be used as a macro hedge against rising interest rates with less exposure to equity beta and negative correlation to fixed income beta. The underlying bonds are all U.S. agency credit that are guaranteed by FNMA, FHLMC or GNMA. Also, timing is on our side as the strategy generates current income if interest rates were to remain within a trading range. FIXP offers a broadly diversified exposure to multiple sectors of the fixed income markets in an algorithmically optimized manner.
Please contact us to explore how RISR and FIXP can be utilized as a unique tool to adjust your portfolio allocations in the current high volatility environment.
| Yung Lim | Dean Smith | George Lucaci |
|---|---|---|
| Chief Executive Officer | Chief Strategist and Marketing Officer | Global Head of Distribution |
| Chief Investment Officer | RISR Portfolio Manager | |
| ylim@foliobeyond.com | dsmith@foliobeyond.com | glucaci@foliobeyond.com |
| 917-892-9075 | 914-523-2180 | 908-723-3372 |
This material must be preceded or accompanied by a prospectus. For a copy of the prospectus please click here for RISR and here for FIXP.
Investments involve risk. Principal loss is possible. Unlike mutual funds, ETFs trade at a premium or discount to their net asset value. The fund is new and has limited operating history to judge fund risks. The value of MBS IOs is more volatile than other types of mortgage related securities. They are very sensitive not only to declining interest rates, but also to the rate of prepayments. MBS IOs involve the risk that borrowers default on their mortgage obligations or the guarantees underlying the mortgage-backed securities will default or otherwise fail and that, during periods of falling interest rates, mortgage-backed securities will be called or prepaid, which result in the Fund having to reinvest proceeds in other investments at a lower interest rate.
The Fund’s derivative investments have risks, including the imperfect correlation between the value of such instruments and the underlying assets or index; the loss of principal, including the potential loss of amounts greater than the initial amount invested in the derivative instrument. The value of the Fund’s investments in fixed income securities (not including MBS IOs) will fluctuate with changes in interest rates. Typically, a rise in interest rates causes a decline in the value of fixed income securities owned indirectly by the Fund. Please see the prospectus for a complete description of principal risks.
FIXP Risks
Underlying ETFs Risks. The Fund will incur higher and duplicative expenses because it invests in underlying ETFs, including Bond Sector ETFs and broad-based bond ETFs (collectively, “Underlying ETFs”). There is also the risk that the Fund may suffer losses due to the investment practices of the Underlying ETFs. The Fund will be subject to substantially the same risks as those associated with the direct ownership of securities held by the Underlying ETFs.
Fixed Income Risk. The prices of fixed income securities respond to economic developments, particularly interest rate changes, as well as to changes in an issuer's credit rating or market perceptions about the creditworthiness of an issuer. In general, the market price of fixed income securities with longer maturities will increase or decrease more in response to changes in interest rates than shorter-term securities.
Option Overlay Risk. The Fund's use of options involves various risks, including the risk that the options strategy may not provide the desired increase in income or may result in losses. Selling call and put options exposes the Fund to potentially significant losses if market movements are unfavorable. The Fund may also experience additional volatility and risk due to changes in implied volatility (the market's forecast of future volatility), strike prices, and market conditions. The Fund may sell options on instruments other than the Fund's Bond Sector ETFs. This can expose the Fund to the risk that options can vary in price in ways that do not correspond to the Bond Sector ETFs held by the Fund, so called basis-risk.
Interest Rate Risk. Generally, the value of fixed income securities will change inversely with changes in interest rates. As interest rates rise, the market value of fixed income securities tends to decrease. Conversely, as interest rates fall, the market value of fixed income securities tends to increase.
New Fund Risk. The Fund is a recently organized management investment company with no operating history. As a result, prospective investors do not have a track record or history on which to base their investment decisions.
Diversification does not eliminate the risk of experiencing investment losses.
Index Definitions
Bloomberg Barclays US Aggregate Bond Index: A broad-based benchmark that measures the investment grade, US dollar-denominated, fixed-rate taxable bond market. The index includes Treasuries, government-related and corporate securities, MBS (agency fixed-rate and hybrid ARM pass-throughs), ABS and CMBS (agency and non-agency).
US Treasury 7-10 Yr Bond Inversed Index: ICE U.S. Treasury 7-10 Year Bond 1X Inverse Index is designed to provide the inverse of the daily return of the ICE U.S. Treasury 7-10 Year Bond Index (IDCOT7). ICE U.S. Treasury 7-10 Year Bond Index tracks the performance of US dollar denominated sovereign debt publicly issued by the US government in its domestic market. Qualifying securities of the underlying index must have greater than or equal to seven years and less than 10 years remaining term to final maturity as of the rebalancing date, a fixed coupon schedule and an adjusted amount outstanding of at least $300 million.
S&P 500 Index: The S&P 500 Index, or Standard & Poor's 500 Index, is a market-capitalization-weighted index of 500 leading publicly traded companies in the U.S.
IBOXHY Index: iBoxx USD Liquid High Yield Total Return Index measures the USD denominated, sub-investment grade, corporate bond market. The index includes bonds with minimum 1 years to maturity,
minimum amount outstanding of USD 400 mil. Bond type includes fixed-coupon, step-up, bonds with
sinking funds, medium term notes, callable and putable bonds.
Definitions
Alpha: a return achieved above and beyond the return of a benchmark or proxy with a similar risk level.
Annualized Equivalent Yield: represents the annualized yield based on the most recent month of income distribution: (income distribution x 12 months)/price per share.
Basis Points (bps): Is a unit of measure used in quoting yields, changes in yields or differences between yields. One basis point is equal to 0.01%, or one one-hundredth of a percent of yield and 100 basis points equals 1%.
Beta measures: the volatility of a security or portfolio relative to an index. Less than one means lower volatility than the index; more than one means greater volatility.
Convexity: A measure of how the duration of a bond changes in correlation to an interest rate change. The greater the convexity of a bond the greater the exposure of interest rate risk to the portfolio.
Correlation: a statistic that measures the degree to which two securities move in relation to each other.
Coupon: is the annual interest rate paid on a bond, expressed as a percentage of the bond’s face value.
CUSIP: An identifier number that stands for the Committee on Uniform Securities Identification Procedures assigned to stocks and registered bonds in the United States and Canada.
Duration: measures a bond price’s sensitivity to changes in interest rates. The longer a bond’s duration, the higher its sensitivity to changes in interest rates and vice versa.
GNMA: Government National Mortgage Association
FNMA: Federal National Mortgage Association
FHLMC: Federal Home Loan Mortgage Corporation
Short Investment (Shorting): is a position that has been sold with the expectation that it will decrease in value, the intention being to repurchase it later at a lower price.
Distributed by Foreside Fund Services, LLC.