RISR & FIXP Commentary for December
Click here for a pdf version of this commentary.
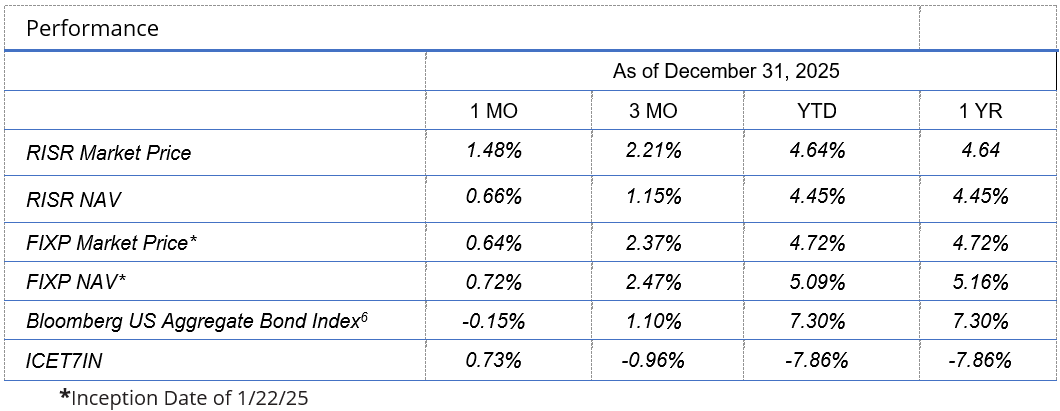
RISR Performance Summary
The FolioBeyond Alternative Income and Interest Rate Hedge ETF (ticker: RISR) returned 1.48% based on the closing market price (0.66% based on net asset value or “NAV”) in December. In comparison, the ICET7IN Index (US Treasury 7-Year Bond Inverse Index) returned 0.73% while the Bloomberg Barclays U.S. Aggregate Bond Index ("AGG") returned -0.15% during the same period.
The performance data quoted represents past performance. Past performance does not guarantee future results. The investment return and principal value of an investment will fluctuate so that an investor’s shares, when sold or redeemed, may be worth more or less than their original cost and current performance may be lower or higher than the performance quoted. Performance current to the most recent month-end can be obtained by calling 866-497-4963. Short-term performance, in particular, is not a good indication of the fund’s future performance, and an investment should not be made based solely on returns. Returns beyond 1 year are annualized.
A fund's NAV is the sum of all its assets less any liabilities, divided by the number of shares outstanding. The market price is the most recent price at which the fund was traded. The fund intends to pay out income, if any, monthly. There is no guarantee that these distributions will be made.
Total Expense Ratio is 1.04%.
For standardized performance click here.
RISR produced a positive return in December despite a 25 basis point cut in the Federal Funds rate on December 10. This was widely anticipated by the market, but there were several dissenting votes, both more hawkish and more dovish among committee members. As has been the case for some time, THE Fed had to contend with a somewhat softer labor market, even as inflation remained stubbornly above their stated 2% target. Aside from the rate cut, the Fed made announcements regarding management of their balance sheet, that many took as accommodating, although in his press conference Fed Chair Powell took pains to counter this narrative. The 10-year Treasury yield had already climbed by around 10 bps prior to the Fed meeting and churned in that 4.17% range for the remainder of the month.
The Q3 GDP report, which had been delayed due to the government shutdown, showed a robust 4.3% YoY growth in economic activity. This was a very surprising result as the consensus forecast was for 3.3% and was the strongest GDP print in two years. In that same report, however, the GDP Price Index came in at 3.5%, also well above the 2.7% forecasters’ consensus.
In response to the strong economic data and ongoing concerns over tariffs, the yield curve steepened materially during December, which continued a trend observed throughout the year. This suggests that investors remain concerned about future inflation, even as the Fed and the White House began rhetorically to address the “affordability” crisis, after mostly ignoring or denying it existed for most of the year.
Treasury Yield Curve 12/31/25 v 12/31/24
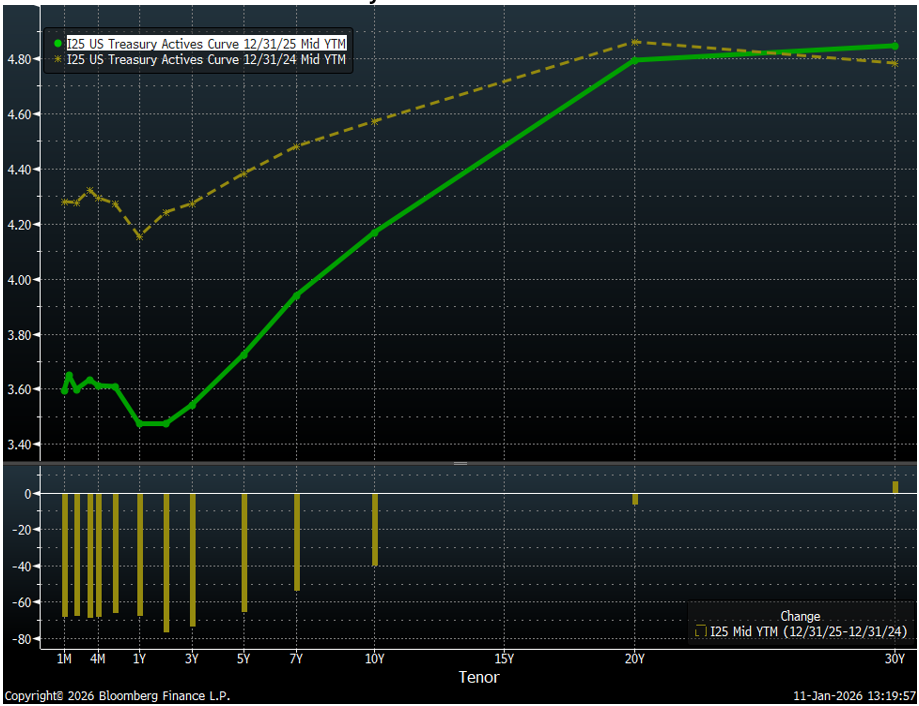
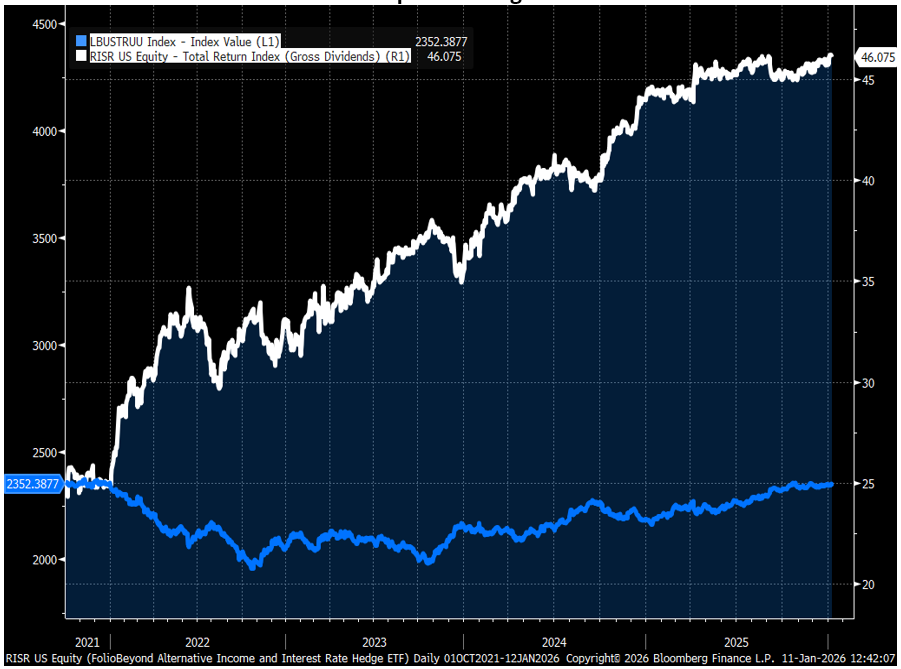
As we have noted numerous times previously, a steep yield curve can be very beneficial to RISR, and is one of the reasons we were able to produce a respectable positive return for the year despite the fact that rates generally ended the year lower than at the start. In other words, in 2025 RISR again proved its worth to fixed income investors, acting as a buffer against volatility and rising interest rates, while still generating positive return and cash flow, even when rates decline. In the four-plus years since inception RISR has produced a positive return each year, and has far outperformed the broad US bond market, on a total return basis, as seen in the chart below. This was our objective in launching the fund, and we are very pleased it has done so.
RISR Total Return vs the Bloomberg US Aggregate Index Total Return
10/2/21 Inception through 12/31/25
In response to the lower Treasury yields, mortgage rates also declined in December, but not by as much. Mortgage rates at year end were well below the highest levels seen in 2023-24, but still held well above the lows for most of the 2000s.
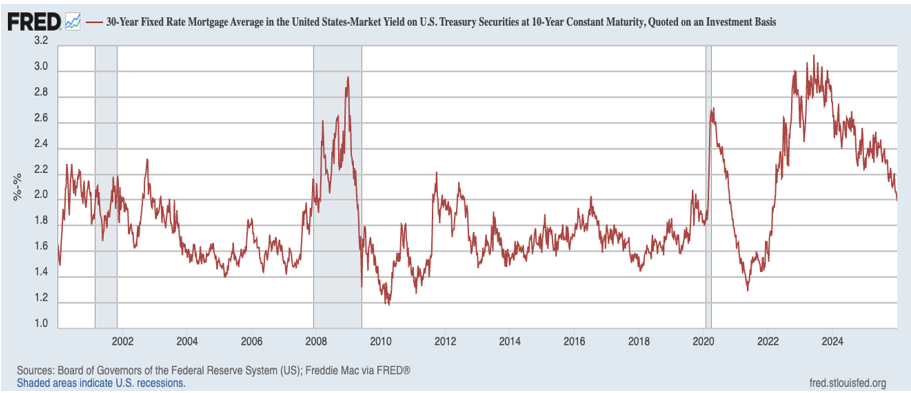
Because of this, mortgage prepayment speeds remain suppressed, as homeowners with very low interest rate mortgages obtained in the period immediately following Covid, are “trapped” in that they would face materially higher payments if they were to sell and buy a new home, even if the value of that home was close to or the same as their current residence. The White and others have proposed a number of quick-fix gimmicks to address this. But all of the proposals floated so far are either impractical, illegal or both.
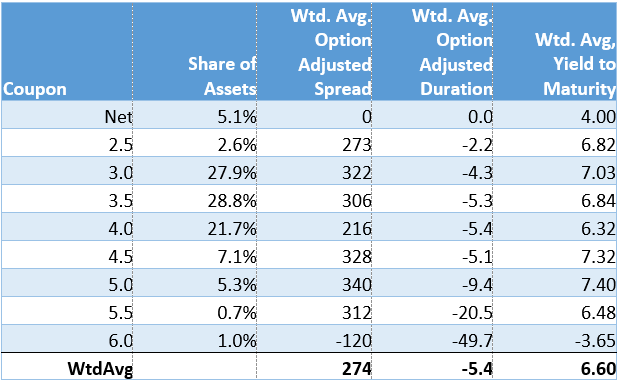
As we have noted in prior commentaries, RISR’s portfolio consists principally of mortgage loans with interest rates that are still far “out of the money” for refinance. Even if mortgage rates were to fall below 6%, it would only affect a very small percentage of our holdings.
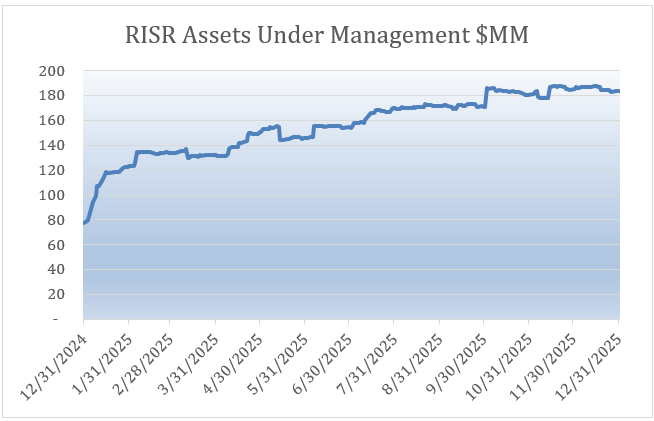
RISR also saw substantial asset growth during 2025. Our shares outstanding grew from 2.14 million to 5.11 million, and our net assets grew from $78 million to more than $183 million.
FIXP Performance Summary
FolioBeyond’s Enhanced Fixed Income Premium ETF (ticker: “FIXP”) seeks to provide income and, secondarily, long-term capital appreciation. The Fund invests in a portfolio of ETFs representing certain sectors of the fixed income market. In addition, the Fund seeks to generate additional income by writing options on these same ETFs, or other ETFs we believe have attractive prices and desirable correlation and volatility characteristics.
For the month of December, FIXP returned 0.81% (0.83% based on NAV), to bring the full year return to 5.09% (5.16% based on NAV). The only portfolio reallocation during the month was the sale of BKLN and its replacement with SJNK. All other weightings changed slightly due to differential performance.
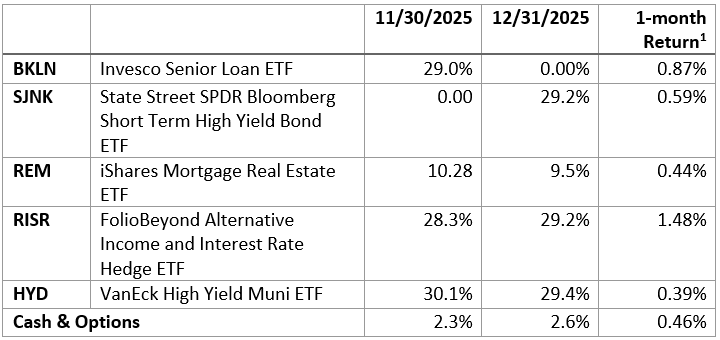
[1] 1-month returns, not weighted for holding period by FIXP.
As the table shows, FIXP’s performance was driven principally by a strong outperformance of RISR, as described above. All other positions made a positive contribution to performance. In addition, the Fund’s option overlay contributed approximately 18 bps of monthly performance for the month of December.
The fund’s holding weights are produced by FolioBeyond’s dynamic reallocation model. Changes are made from a universe of 24 economically diverse fixed income ETFs, based on volatility, momentum, yield, default risk, and other factors and occur based on market observations rather than a fixed schedule. For the last handful of reallocations most of the changes have been between REM, BKLN and SJNK. This is not surprising given the volatile and shifting environment for real estate assets (REM), on the one hand, vs. high-yield corporates (SJNK) and bank loans, on the other.
The performance data quoted represents past performance. Past performance does not guarantee future results. The investment return and principal value of an investment will fluctuate so that an investor’s shares, when sold or redeemed, December be worth more or less than their original cost and current performance and December be lower or higher than the performance quoted. Performance current to the most recent month-end can be obtained by calling 866-497-4963. Short-term performance, in particular, is not a good indication of the fund’s future performance, and an investment should not be made based solely on returns. Returns beyond 1 year are annualized.
A fund's NAV is the sum of all its assets less any liabilities, divided by the number of shares outstanding. The market price is the most recent price at which the fund was traded. The fund intends to pay out income, if any, monthly. There is no guarantee that these distributions will be made.
Total Expense Ratio is 1.01%.
For FIXP standardized performance and fund holdings click here.
The allocation model that FIXP uses has been running for private clients and model portfolios for more than three years, and we are very excited to be bringing this advanced algorithm to ETF investors. Please reach out to us to learn more and to obtain detailed information and fund documents.
Market Outlook for 2026
It’s hard to know where to start when thinking about the prospects for 2026. We have rarely seen periods with more uncertainty around basic economic indicators, and especially around policy. Whether you support or disagree with the economic policies of the current administration, the process has certainly been chaotic. It is not likely to get more disciplined or focused in 2026.
Nonetheless, there are a few major themes that investors, especially in the fixed-income sector, need to pay particular attention to:
· Federal Reserve Policy
· Government Spending, Debt and Deficits
· Housing Affordability
· Tariffs
Obviously, one could add countless other important topics, but we are aiming for concision here, not trying to be comprehensive.
Federal Reserve Policy
Since the Fed Funds rate peaked at 5.5% in Q3 2023 and was there for more than a year, the FOMC has lowered its benchmark rate six times, for a total of 175 basis points in reductions. Since the first cut in September of 2024, the Fed has cut rates at six out of eleven meetings.
At the current level of 3.75%, the Fed Funds rate is below the average for the last half-century, but well above the ZIRP-based [2] levels in place since the great financial crisis of 2008 (“GFC”). Opinions vary widely, as is the case in all markets, but the mild central tendency is that short-term rates are about where they ought to be, give or take 25 bps. The Trump Administration obviously disagrees strongly with that view. They have publicly stated rates should be immediately reduced to 1%, although that may be hyperbole. With Trump one can never be completely sure.
What is important to keep in mind is that the Fed Funds rate is about the least economically significant rate in the economy, except perhaps as a signal. Far more important for investment and economic growth are longer-term rates, especially from 10-years and out to 30-year maturities. As discussed above, these rates have not fallen nearly as much as Fed Funds, and in the case of the 30-year, have even increased a bit. These are the rates that drive capital investment decision in things like plant and equipment, and also drive mortgage rates for both residential and commercial real estate.
The other tool the Fed has, at least theoretically, is the use of its balance sheet to buy Treasuries (or possibly MBS) to try to increase prices, and thus lower yields. Since the GFC, and then Covid, the Fed’s balance sheet ballooned to almost $9 trillion, an effort known as quantitative easing or “QE.” Not surprisingly, this was a big contributor to the post-covid inflation spike. Since then, they have sold or allowed to run off around $2.3 trillion, but they are still holding more than $6.5 trillion. This compares to less than $1 trillion prior to the GFC.
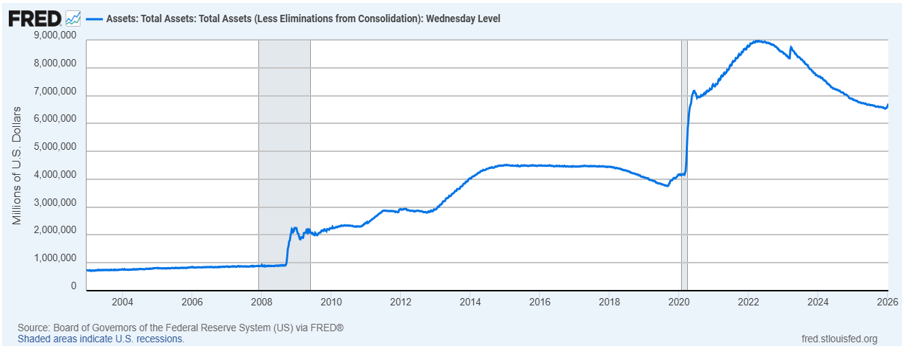
The pace of runoff has slowed in recent months, and the Fed has made vague statements about roughly maintaining this level of assets. But they are very sensitive to resuming large-scale asset purchases to help drive down longer-term rates precisely for fear of re-sparking inflation. This is the corner the Fed has painted itself into. As labor markets show signs of softening, they have very little ammunition with which to respond.
It is our view that, unless labor market conditions weaken sharply, the Fed is pretty much stuck here. That means, few if any further cuts in Fed Funds in 2026, and a yield curve that stays steep since they can’t easily monetize the massive spending needs of the government without risking a re-acceleration in inflation. It is for that reason, we believe they will, stealthily raise their inflation target from 2% to 3%, where it basically is now. There will be rhetoric around this, denying any surrender. But surrender—to reality—they must.
Government Spending, Debt and Deficits
The One Big Beautiful Bill passed by Congress and signed by the President last year, is a fiscal policy disaster. Many of its worst provisions will take effect this year and will inevitably balloon the federal debt. The Federal government will have to borrow $1.7 trillion in 2026, which is close to the all-time high, leaving aside the Covid emergency spending in 2020-21. By the end of the decade, the federal debt is officially projected to increase by some $9 trillion, which would put it at around 110% of GDP. And these spending projections are almost surely too low. President Trump has separately proposed raising the defense budget by 50%. Spending on interest alone in 2026 will total some $1.3 trillion in 2026, and will soon be the largest line item in the federal budget.
Aside from a few gadflies, there is no longer any political faction in Washington on the side of fiscal discipline and debt reduction. If the Democrats take one or both houses of Congress, the only thing they and the Republican will be able to agree on in more spending. Polymarkets currently places the odds of this at around 80%, with a 36% chance of a Democrat sweep of both houses.
Of course, the increase in borrowing needs for the US couldn’t come at a worse time, since many non-US investors, governments and central banks are looking to reduce, rather than increase their exposure to the US government. This is occurring for a variety of reasons, but the current administration’s foreign policy stance plays a large role. A complete substitution put of Treasuries is of course, impossible. But prices (i.e., interest rates) are set at the margin. Even a relatively small reduction in foreign demand for US debt can have a large impact on prices.
As with the Fed’s conundrum, all the fiscal policy forces are in the direction of higher interest rates. And this doesn’t even begin to address the upcoming breakdown in entitlements for Social Security, Medicare and Medicaid, all of which are on track to insolvency in a handful of years. From this perspective, it is very difficult to make an economic case for materially lower medium- and long-term interest rates in 2026 and later.
Housing Affordability
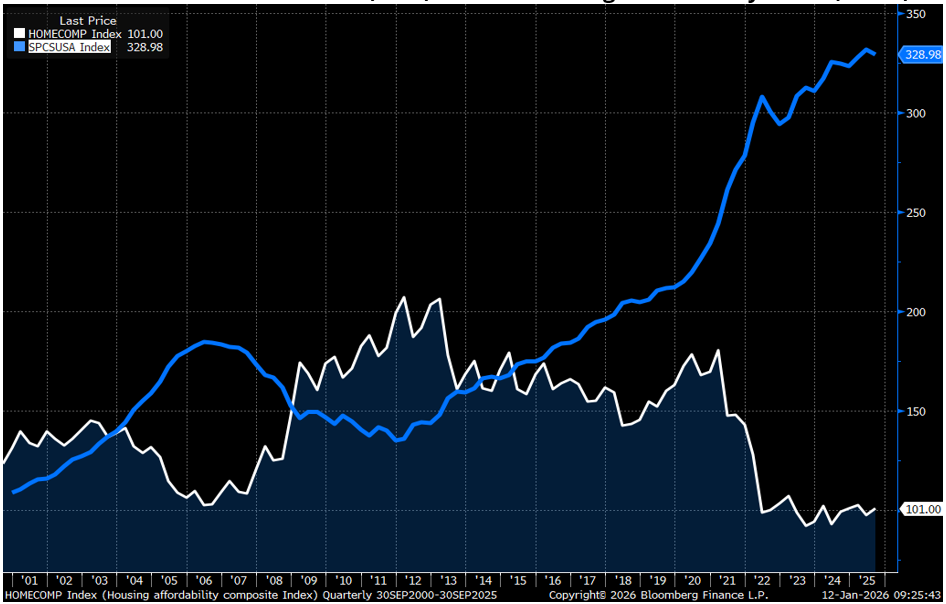
Those watching closely have been warning of an affordability in housing costs for at least the last 5-7 years. 2025 was the year the political class finally took notice. The combination of skyrocketing home prices, stagnant wage growth and high interest rates have combined to push housing affordability, measured as income to housing costs, to near all-time lows.
As noted above, various proposals have been floated to improve affordability, but nothing proposed so far has a realistic chance of addressing the real problem. Simply put, the US economy has for years not built enough homes to meet the demand of a growing population. There is currently a multi-million home deficit, and much of the existing housing stock is obsolescent, or too far north/east to meet demands. The US population has shifted dramatically to the south and west over the last 20-30 years, as the industrial base in old “rust-belt” cities has decayed. Even if initiatives to revive manufacturing are successful, an extremely hopeful proposition, the new plants will not be located in Detroit, Pittsburgh, Cleveland or Buffalo. They will be built in Texas, Arizona and North Carolina. Consider for example, Tesla’s 10 million square-foot Gigafactory in Austin TX.
Case-Shiller Home Price Index (blue) vs. NAR Housing Affordability Index (white)
Housing affordability will not be sustainably improved until this basic supply-demand imbalance is rectified. This will take years, not months or quarters. Gimmicky proposals such as longer amortization terms, portable mortgage loans, defeasance schemes, and the like will not move the needle, and may actually make the situation worse.
There needs to be a genuine “Manhattan Project” style program to address the massive shortage of housing. One might think a president with a real estate developer background would see this as an opportunity to make a lasting positive change in the well-being for American households. So far, there has been no indication of administration thinking along those lines. So once again, the US housing market appears to be frozen in a very sub-optimal dis-equilibrium that seems unlikely to thaw in the near-term.
The impact for investors is a continued slow pace of home purchases, and prepayments for the foreseeable future.
n.b. As of this writing, President Trump announced a goal for Fannie Mae and Freddie Mac to purchase $200bn in “mortgage bonds.” It is very unclear what that would entail, but initial estimates by housing economists suggest at could maybe reduce mortgage rates by around 25 bps. Not nothing, but not a game changer, by any means. There are some $13 trillion on residential mortgages outstanding today. So, $200 billion represents about a 1.5% market share.
Tariffs
Perhaps the biggest question facing the Administration early in 2026 is the fate of the IEEPA [3] tariffs announced last April. The US Supreme Court heard arguments for and against last fall, and is expected to make a ruling on their legality in coming weeks. Court observers suggest the Court is leaning in the direction of striking them down, but it is impossible to say with certainty how the Court will rule based on the Q&A in the public hearings.
The two main questions the Court will rule on are 1) Does IEEPA allow to President to impose broad-based tariffs as were implemented in 2025; and 2) If not, must the tariffs already collected have to be refunded, and if so how?
The Administration, naturally, argues they have the authority. But even if they lose at the Supreme Court, they contend they have alternative legal authorities that will allow them to keep some form of tariffs in place. However the Court rules on both questions, the tariff issue is going to be weighing on markets for some time to come. It is exceedingly unlikely the President’s team would simply “take the L” and gracefully move on. The necessity of tariffs is quasi-religious belief for President Trump, and his economic team.
The impact of tariffs to date has been mixed, and removal of the IEEPA broad-based tariffs would be as well. This is largely because businesses have absorbed a large share of the tariff cost, without passing it on to end users, largely on the belief they would be struck down by the courts. It does seem clear, however, that the tariffs that have been pushed through have added some amount to measured inflation. In addition, the impact has varied greatly across supply chains.
Economists are fond of pointing out, somewhat pedantically, that the tariffs are a “one time” shock and shouldn’t be counted as inflation, a sort of “no true Scotsman” line of argument. Consumers don’t care. When prices for imported goods increase, they perceive that as inflation. Defining it away does nothing.
In short, while we can expect a SCOTUS ruling early in 2026, the tariff issue isn’t going away. It may actually become even less transparent and more impactful, depending on how aggressively the Administration pursues alternatives.
Summary
While these are some of the big factors that will drive investment risk and return in 2026, there are a large number of others. These include AI, geo-political surprises, immigration policy and management, potential political gridlock following the mid-term elections, and more. The only prediction that has a very high probability of being correct is continued volatility policy uncertainty.
There is a prudent, well-established playbook for this type of environment. Preserve your capital and look for investments that are designed to generate current cash income. Trying to trade the news or time the markets in such an environment is reckless in the extreme. The news will always be faster and more unpredictable that you are as an investor.
Please contact us to explore how RISR and FIXP might fit into your overall strategy, to help you manage risk while striving to generate an attractive current yield. Best of luck to our investors in 2026!
[2] “Zero Interest Rate Policy”
[3] IEEPA is the International Emergency Economic Powers Act, of 1977
Portfolio Applications
We believe RISR and FIXP can provide attractive, thematic strategies that provide strong correlation benefits for both fixed income and equity portfolios. They can be utilized as part of a core holdings for diversified portfolios or as an overlay to manage the risks of fixed income portfolios. RISR can be used as a macro hedge against rising interest rates with less exposure to equity beta and negative correlation to fixed income beta. The underlying bonds are all U.S. agency credit that are guaranteed by FNMA, FHLMC or GNMA. Also, timing is on our side as the strategy is designed to generate current income if interest rates were to remain within a trading range. FIXP offers a broadly diversified exposure to multiple sectors of the fixed income markets in an algorithmically optimized manner.
Please contact us to explore how RISR and FIXP can be utilized as a unique tool to adjust your portfolio allocations in the current high volatility environment.
| Yung Lim | Dean Smith | George Lucaci |
|---|---|---|
| Chief Executive Officer | Chief Strategist and Marketing Officer | Global Head of Distribution |
| Chief Investment Officer | RISR Portfolio Manager | |
| ylim@foliobeyond.com | dsmith@foliobeyond.com | glucaci@foliobeyond.com |
| 917-892-9075 | 914-523-2180 | 908-723-3372 |
This material must be preceded or accompanied by a prospectus. For a copy of the prospectus please click here for RISR and here for FIXP.
Investments involve risk. Principal loss is possible. Unlike mutual funds, ETFs trade at a premium or discount to their net asset value. The fund is new and has limited operating history to judge fund risks. The value of MBS IOs is more volatile than other types of mortgage related securities. They are very sensitive not only to declining interest rates, but also to the rate of prepayments. MBS IOs involve the risk that borrowers default on their mortgage obligations or the guarantees underlying the mortgage-backed securities will default or otherwise fail and that, during periods of falling interest rates, mortgage-backed securities will be called or prepaid, which result in the Fund having to reinvest proceeds in other investments at a lower interest rate.
The Fund’s derivative investments have risks, including the imperfect correlation between the value of such instruments and the underlying assets or index; the loss of principal, including the potential loss of amounts greater than the initial amount invested in the derivative instrument. The value of the Fund’s investments in fixed income securities (not including MBS IOs) will fluctuate with changes in interest rates. Typically, a rise in interest rates causes a decline in the value of fixed income securities owned indirectly by the Fund. Please see the prospectus for a complete description of principal risks.
The Morningstar Rating™ for funds, or "star rating," is calculated for managed products (including mutual funds, variable annuity and variable life subaccounts, exchange-traded funds, closed-end funds and separate accounts) with at least a three-year history without adjustment for sales load. Exchange-traded funds and open-ended mutual funds are considered a single population for comparative purposes. It is calculated based on a Morningstar Risk- Adjusted Return measure that accounts for variation in a managed product's monthly excess performance, placing more emphasis on downward variations and rewarding consistent performance. The top 10% of products in each product category receive five stars, the next 22.5% receive four stars, the next 35% receive three stars, the next 22.5% receive two stars, and the bottom 10% receive one star. The Overall Morningstar Rating™ for a managed product is derived from a weighted average of the performance figures associated with its three-, five- and 10-year (if applicable) Morningstar Rating™ metrics. The weights are: 100% three-year rating for 36 - 59 months of total returns, 60% five-year rating/40% three-year rating for 60 - 119 months of total returns, and 50% 10-year rating/30% five-year rating/20% three-year rating for 120 or more months of total returns. While the 10-year overall star rating formula seems to give the most weight to the 10-year period, the most recent three-year period actually has the greatest impact because it is included in all three rating periods. As of 9/30/2024, RISR was rated against the following number of Nontraditional Bond Funds over the following periods: 272 for the 3-year time period. RISR received 5 stars for those periods. Ratings for other share classes December differ. Past performance is no guarantee of future results.
FIXP Risks
Underlying ETFs Risks. The Fund will incur higher and duplicative expenses because it invests in underlying ETFs, including Bond Sector ETFs and broad-based bond ETFs (collectively, “Underlying ETFs”). There is also the risk that the Fund may suffer losses due to the investment practices of the Underlying ETFs. The Fund will be subject to substantially the same risks as those associated with the direct ownership of securities held by the Underlying ETFs.
Fixed Income Risk. The prices of fixed income securities respond to economic developments, particularly interest rate changes, as well as to changes in an issuer's credit rating or market perceptions about the creditworthiness of an issuer. In general, the market price of fixed income securities with longer maturities will increase or decrease more in response to changes in interest rates than shorter-term securities.
Option Overlay Risk. The Fund's use of options involves various risks, including the risk that the options strategy may not provide the desired increase in income or may result in losses. Selling call and put options exposes the Fund to potentially significant losses if market movements are unfavorable. The Fund may also experience additional volatility and risk due to changes in implied volatility (the market's forecast of future volatility), strike prices, and market conditions. The Fund may sell options on instruments other than the Fund's Bond Sector ETFs. This can expose the Fund to the risk that options can vary in price in ways that do not correspond to the Bond Sector ETFs held by the Fund, so called basis-risk.
Interest Rate Risk. Generally, the value of fixed income securities will change inversely with changes in interest rates. As interest rates rise, the market value of fixed income securities tends to decrease. Conversely, as interest rates fall, the market value of fixed income securities tends to increase.
New Fund Risk. The Fund is a recently organized management investment company with no operating history. As a result, prospective investors do not have a track record or history on which to base their investment decisions.
Diversification does not eliminate the risk of experiencing investment losses.
Index Definitions
Bloomberg Barclays US Aggregate Bond Index: A broad-based benchmark that measures the investment grade, US dollar-denominated, fixed-rate taxable bond market. The index includes Treasuries, government-related and corporate securities, MBS (agency fixed-rate and hybrid ARM pass-throughs), ABS and CMBS (agency and non-agency).
US Treasury 7-10 Yr Bond Inversed Index: ICE U.S. Treasury 7-10 Year Bond 1X Inverse Index is designed to provide the inverse of the daily return of the ICE U.S. Treasury 7-10 Year Bond Index (IDCOT7). ICE U.S. Treasury 7-10 Year Bond Index tracks the performance of US dollar denominated sovereign debt publicly issued by the US government in its domestic market. Qualifying securities of the underlying index must have greater than or equal to seven years and less than 10 years remaining term to final maturity as of the rebalancing date, a fixed coupon schedule and an adjusted amount outstanding of at least $300 million.
S&P 500 Index: The S&P 500 Index, or Standard & Poor's 500 Index, is a market-capitalization-weighted index of 500 leading publicly traded companies in the U.S.
IBOXHY Index: iBoxx USD Liquid High Yield Total Return Index measures the USD denominated, sub-investment grade, corporate bond market. The index includes bonds with minimum 1 years to maturity,
minimum amount outstanding of USD 400 mil. Bond type includes fixed-coupon, step-up, bonds with
sinking funds, medium term notes, callable and putable bonds.
Definitions
Alpha: a return achieved above and beyond the return of a benchmark or proxy with a similar risk level.
Annualized Equivalent Yield: represents the annualized yield based on the most recent month of income distribution: (income distribution x 12 months)/price per share.
Basis Points (bps): Is a unit of measure used in quoting yields, changes in yields or differences between yields. One basis point is equal to 0.01%, or one one-hundredth of a percent of yield and 100 basis points equals 1%.
Beta measures: the volatility of a security or portfolio relative to an index. Less than one means lower volatility than the index; more than one means greater volatility.
Convexity: A measure of how the duration of a bond changes in correlation to an interest rate change. The greater the convexity of a bond the greater the exposure of interest rate risk to the portfolio.
Correlation: a statistic that measures the degree to which two securities move in relation to each other.
Coupon: is the annual interest rate paid on a bond, expressed as a percentage of the bond’s face value.
CUSIP: An identifier number that stands for the Committee on Uniform Securities Identification Procedures assigned to stocks and registered bonds in the United States and Canada.
Duration: measures a bond price’s sensitivity to changes in interest rates. The longer a bond’s duration, the higher its sensitivity to changes in interest rates and vice versa.
GNMA: Government National Mortgage Association
FNMA: Federal National Mortgage Association
FHLMC: Federal Home Loan Mortgage Corporation
Short Investment (Shorting): is a position that has been sold with the expectation that it will decrease in value, the intention being to repurchase it later at a lower price.
Distributed by Foreside Fund Services, LLC.